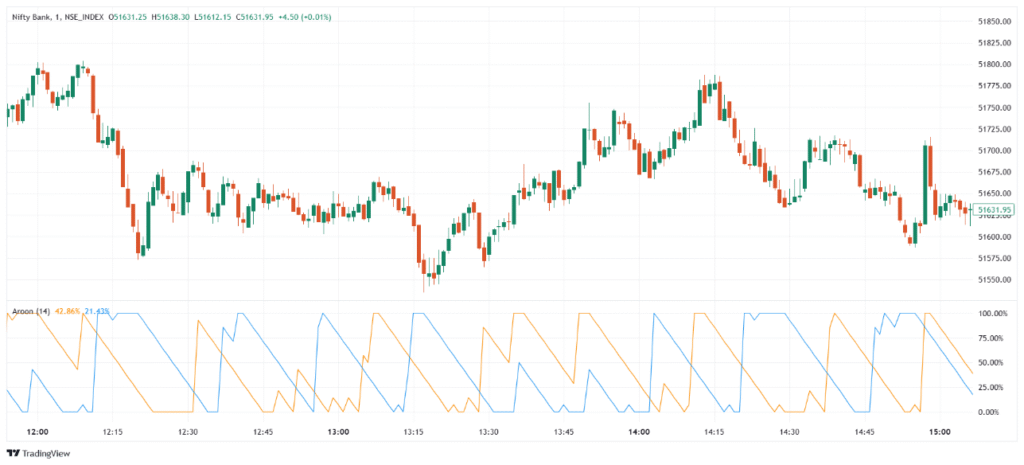
The Aroon Indicator is a trend-identifying tool developed by Tushar Chande. It helps determine whether an asset is trending or consolidating and how strong that trend is. The indicator consists of two lines: Aroon Up (measuring how recently the highest high occurred) and Aroon Down (measuring how recently the lowest low occurred) over a set period, usually 14 or 25 days. It ranges from 0 to 100, and higher values indicate a recent high or low, helping traders identify trend strength, reversals, and entry points.
💡 Significance
- Identifies trend direction based on recent highs and lows.
- Measures trend strength using the values of Aroon Up and Down.
- Detects trend reversals when the two lines cross.
- Helps avoid sideways markets by indicating lack of trend.
- Works across all timeframes, from short-term to long-term trading.
📊 Indicator Components & Values
- Aroon Up Line → Measures time since last high; close to 100 = strong uptrend.
- Aroon Down Line → Measures time since last low; close to 100 = strong downtrend.
- Crossovers →
- Aroon Up crosses above Aroon Down → Bullish signal.
- Aroon Down crosses above Aroon Up → Bearish signal.
- Flat Lines or Low Values → Suggest price is ranging or trend is weakening.
- Range → Both lines move between 0 and 100.
🎯 Trading Strategy
- Trend Confirmation → Enter long when Aroon Up is high and above Aroon Down; enter short when Aroon Down is high and above Aroon Up.
- Crossover Strategy → Buy on bullish crossover (Up over Down), sell on bearish crossover (Down over Up).
- Early Exit Signal → Exit trades when the leading Aroon line starts dropping sharply.
- Aroon + Moving Average → Use moving averages to filter signals in trending markets.
- Aroon + RSI → Confirm momentum and trend strength for better entries.
Rate this post
