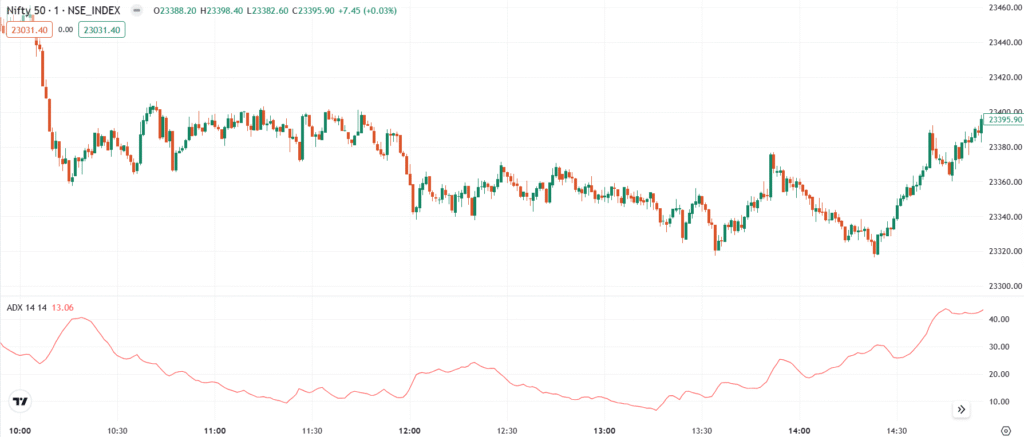
The Average Directional Index (ADX) is a trend strength indicator that measures how strong a price trend is, whether upward or downward. Unlike other indicators, ADX does not indicate trend direction, only the strength of the trend. It is typically plotted along with +DI (Positive Directional Indicator) and -DI (Negative Directional Indicator) to determine trend movement.
💡 Significance
- Measuring trend strength – A higher ADX value indicates a stronger trend.
- Filtering weak trends – Helps traders avoid false signals by identifying weak trends.
- Confirming breakout trends – Useful for identifying whether a breakout is real or false.
- Determining market conditions – If ADX is low, the market may be in a range rather than trending.
📊 Indicator Components
- ADX Line (Main Line)
- Measures the overall strength of the trend.
- Below 20 → Weak trend, sideways movement.
- 20-40 → Moderate trend, trend gaining strength.
- Above 40 → Strong trend, good for trend-following strategies.
- +DI (Positive Directional Indicator)
- Measures the strength of upward movements.
- A rising +DI suggests buyers are in control.
- -DI (Negative Directional Indicator)
- Measures the strength of downward movements.
- A rising -DI suggests sellers are in control.
🎯 Trading Strategy
- Identifying Trend Strength
- If ADX is above 25, the market has a strong trend—trade in the trend’s direction.
- If ADX is below 20, the market is weak or sideways—avoid trend-following trades.
- Buy & Sell Signals
- Buy when +DI crosses above -DI and ADX is rising.
- Sell when -DI crosses above +DI and ADX is rising.
