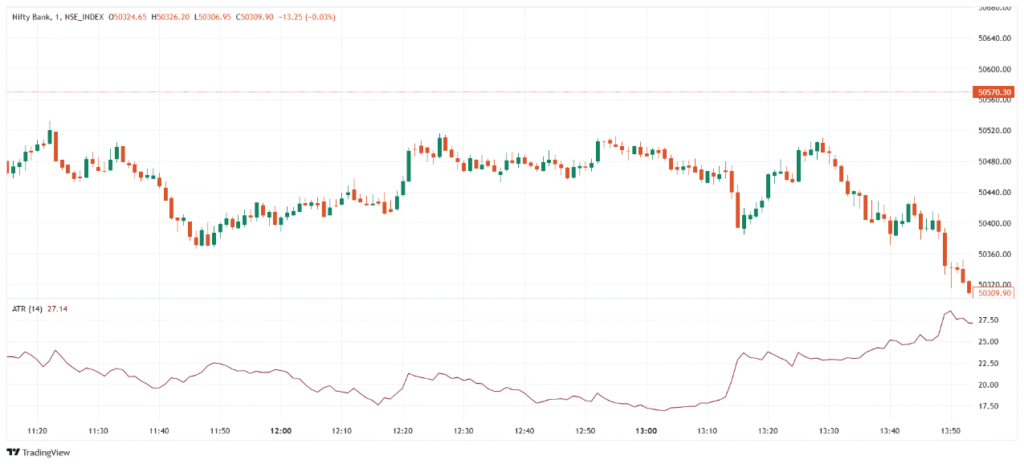
The Average True Range (ATR) is a volatility indicator developed by J. Welles Wilder Jr. in the late 1970s. It measures the average range between high and low prices over a specific period, typically 14 periods. ATR does not indicate trend direction—instead, it shows how much price moves, helping traders understand market volatility. A higher ATR means more volatility, while a lower ATR means quieter market conditions.
💡 Significance
- Measures market volatility to assess how much price typically moves.
- Helps set stop-loss and take-profit levels based on volatility.
- Does not show trend direction, making it useful in any market.
- Useful in all timeframes, from intraday to long-term trading.
- Works best when combined with trend or momentum indicators for trade confirmation.
📊 Indicator Components & Values
- True Range (TR) → The greatest of:
- High − Low
- High − Previous Close
- Previous Close − Low
- Average True Range (ATR) → The moving average of the True Range over a set period (default: 14 periods).
- Rising ATR → Indicates increasing volatility (strong moves).
- Falling ATR → Indicates decreasing volatility (sideways or calm market).
- ATR Value → Shown in price units (e.g., ₹ or $), not percentage.
🎯 Trading Strategy
- Volatility Breakout Strategy → Trade breakouts when ATR is rising, signaling strong movement.
- ATR Stop-Loss Strategy → Set stop-loss at 1 to 2 × ATR below (for long) or above (for short) the entry price.
- Trailing Stop Strategy → Use ATR to trail stops and lock in profits during trends.
- ATR + Moving Average → Combine ATR with a trend indicator to confirm high-volatility breakouts.
- ATR + RSI/MACD → Use ATR to filter signals—trade only when volatility is rising to avoid false entries.
