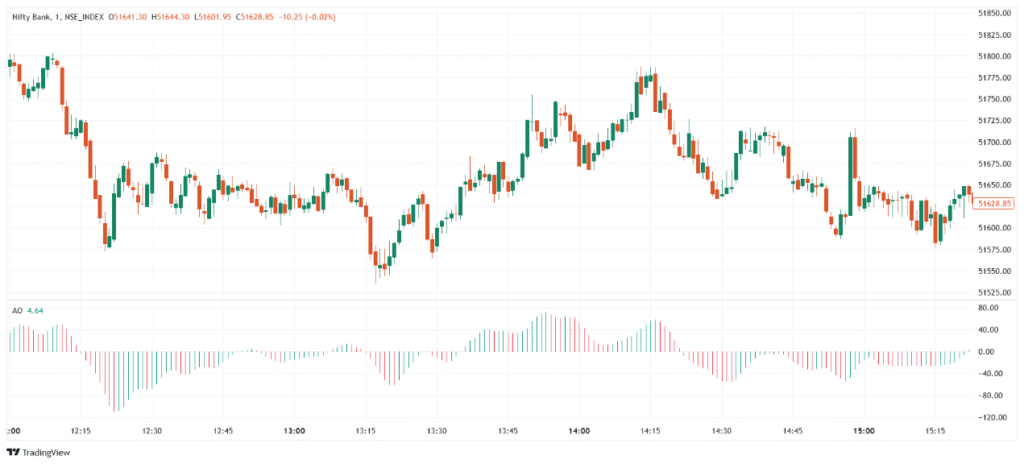
The Awesome Oscillator (AO) is a momentum indicator developed by Bill Williams to measure the strength and direction of a trend. It compares the 34-period and 5-period simple moving averages (SMA) of the median price, plotted as a histogram that fluctuates above and below a zero line. AO helps traders identify trend changes, momentum shifts, and early reversal signals through visual color changes in the bars.
Significance
- Measures market momentum by comparing short- and long-term price averages.
- Identifies trend direction using zero line crossovers.
- Signals momentum shifts through color changes in histogram bars.
- Spots early reversals using patterns like twin peaks or saucers.
- Works across all timeframes, from intraday to long-term charts.
Indicator Components & Values
- AO Histogram → Bars plotted based on the difference between 5-SMA and 34-SMA of median price.
- Zero Line →
- Above Zero → Bullish momentum
- Below Zero → Bearish momentum
- Color Change →
- Green Bar → Stronger momentum than the previous bar
- Red Bar → Weaker momentum than the previous bar
- No fixed levels → Signals depend on crossovers and patterns, not overbought/oversold zones.
Trading Strategy
- Zero Line Crossover →
- Buy when AO crosses above zero, sell when it crosses below zero.
- Saucer Setup →
- Buy when AO is above zero with two red bars followed by a green bar.
- Sell when AO is below zero with two green bars followed by a red bar.
- Twin Peaks Strategy →
- Bullish: Two lows below zero, second peak higher and followed by a green bar.
- Bearish: Two highs above zero, second peak lower and followed by a red bar.
- AO + MACD/RSI → Confirm entries by combining with momentum or trend indicators.
- AO + Price Action → Use AO shifts alongside candlestick patterns or breakout levels.
Rate this post
