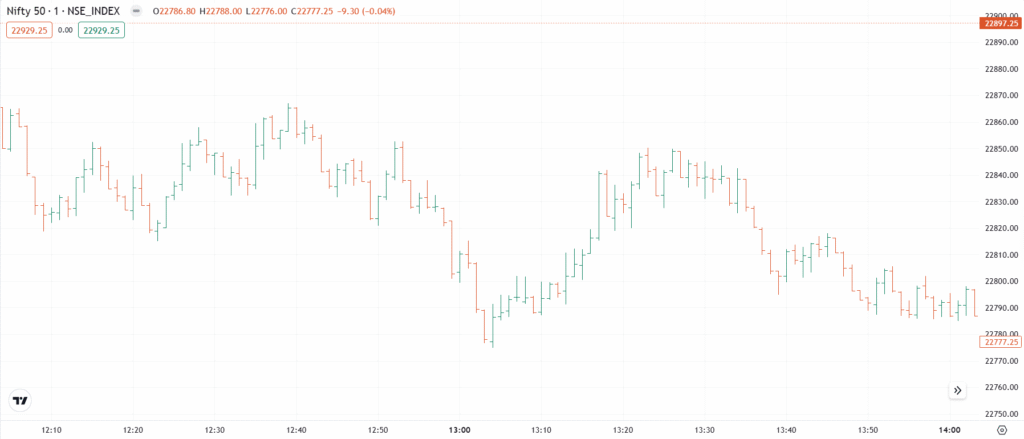
The Bar Chart, also known as the OHLC (Open-High-Low-Close) Chart, was developed in the early 20th century as a more detailed alternative to line charts. Each bar represents four price points: open, high, low, and close, helping traders analyze market volatility and price movements. It is widely used in technical analysis to identify trends and trend reversals.
Chart Construction
- Each bar represents four price points: Open, High, Low, and Close (OHLC).
- A vertical line represents the high-to-low price range.
- Left tick = opening price, Right tick = closing price.
- Color-coded: Green (close higher than open), Red (close lower than open).
Importance
- Provides a detailed view of price movements.
- Useful for identifying trend reversals and price volatility.
- Helps traders analyze bullish and bearish momentum.
Limitations
- More complex to interpret compared to line charts.
- Can be difficult for beginners to analyze multiple bars.
Rate this post
