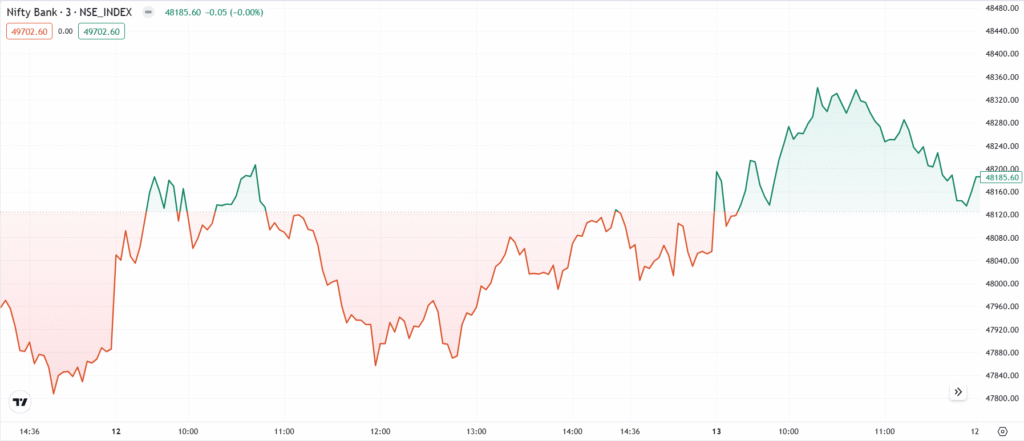
The Baseline Chart is a modern adaptation of the Line Chart, widely used in financial analysis software since the late 20th century. Instead of starting from zero, prices are plotted relative to a fixed baseline level, such as a previous close or key support level. It helps traders compare performance and track market trends relative to a reference point.
Chart Construction
- Works like a line chart but plots prices relative to a fixed baseline level.
- If price is above the baseline = Bullish, if below the baseline = Bearish.
Importance
- Helps traders focus on price movements relative to a key level instead of absolute values.
- Useful for comparing multiple stocks or market indices.
- Helps identify bullish and bearish trends based on their position relative to the baseline.
Limitations
- Does not show detailed price action like open, high, low, and close prices.
- Not ideal for short-term traders who require precise entry and exit points.
Rate this post
