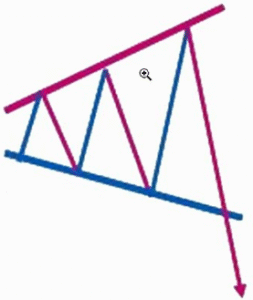
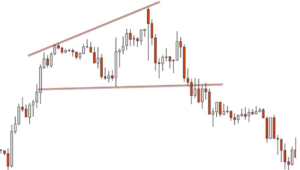
A widening price pattern where price forms higher highs and lower lows, signalling increasing volatility. This pattern suggests market instability and potential trend exhaustion, as bullish momentum weakens despite frequent rallies.
✳️ Pattern Formation
- Forms after a prolonged uptrend, where buyers begin to lose control
- Structure emerges through increasing price swings, signaling exhaustion
- Often seen in distribution phases with unpredictable momentum shifts
🔷 Characteristics
- Composed of expanding highs and lows, forming a broadening triangle
- Resistance and support lines diverge, creating an unstable price range
- Breakout occurs below the lower boundary, confirming bearish intent
- Volume typically spikes on breakdown, validating the reversal
🌐 Market Condition
- Works best in volatile uptrending markets nearing exhaustion
- Suitable for liquid stocks, commodities, and major indices experiencing topping patterns
🎯 Trading Strategy
- Sell when price breaks support with strong volume to confirm the move.
- Set stop-loss slightly above the recent swing high to manage risk.
- Calculate the target by subtracting the pattern width from breakdown level.
Rate this post

