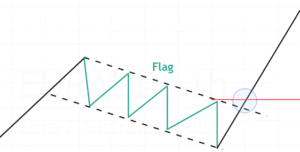
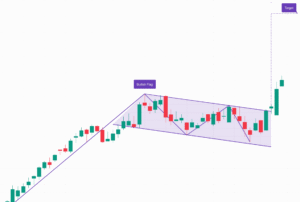
A Bullish Flag is a short-term continuation pattern that appears after a strong price rally. It forms a small downward or sideways consolidation resembling a flag on a pole. Once the price breaks out above the flag, it signals a continuation of the uptrend. This pattern indicates a brief pause before the next upward move.
💡 Significance
- Indicates that buyers are taking a pause before resuming the uptrend.
- Suggests a healthy correction rather than a reversal.
- A breakout above the flag confirms the continuation.
✳️ Pattern Formation
- Forms after a strong upward rally, showing temporary price consolidation
- Pattern completes when price breaks above the flag’s upper boundary
- Commonly observed in momentum-driven and trending markets
🔷 Characteristics
- Price forms a flagpole followed by a small downward or sideways flag
- Trendlines of the flag are parallel or slightly downward-sloping
- Breakout above the flag confirms bullish continuation
- Volume declines during consolidation and spikes on breakout
🌐 Market Condition
- Best suited for bullish trending markets in stocks, indices, or commodities
- Most effective in high-liquidity instruments with strong upward momentum
🎯 Trading Approach
- Buy when price breaks above the flag with strong volume confirmation.
- Set stop-loss just below the lower trendline of the flag consolidation.
- Estimate the target by adding flagpole height to the breakout level.

