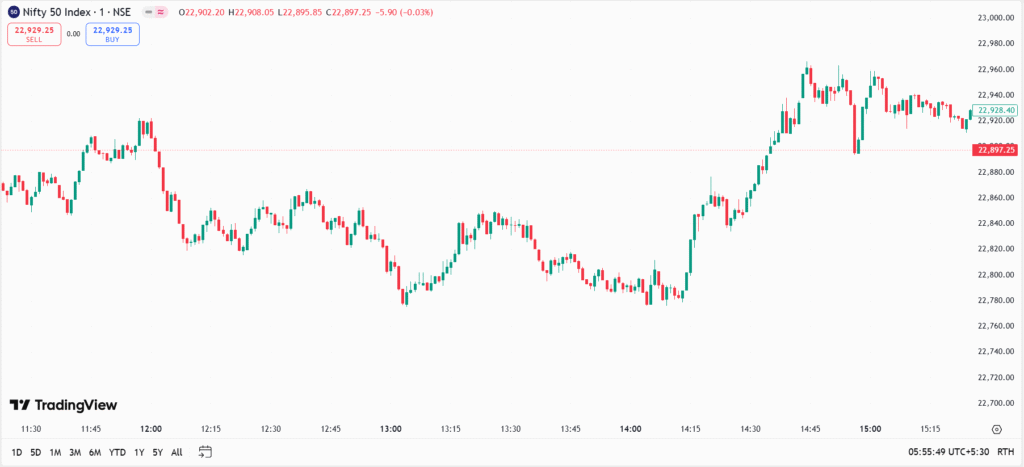
The Candlestick Chart was developed in 18th-century Japan by Munehisa Homma, a rice trader who studied price patterns. It visually represents open, high, low, and close prices using candle-shaped bars. Candlesticks help traders analyze market sentiment, identify trend reversals, and recognize bullish or bearish momentum more clearly than bar charts.
Chart Construction
- Similar to a bar chart but visually enhanced with candle bodies.
- A candle body represents the open-close range, and wicks show the high-low range.
- Green (bullish) candle: Close > Open, Red (bearish) candle: Close < Open.
Importance
- Most popular chart type for technical analysis.
- Helps identify trend reversals, continuations, and market sentiment.
- Provides clear trading signals through candlestick patterns like Doji, Engulfing, and Hammer.
Limitations
- Requires knowledge of candlestick patterns for effective use.
- Can be misleading in low-volume markets.
Rate this post
