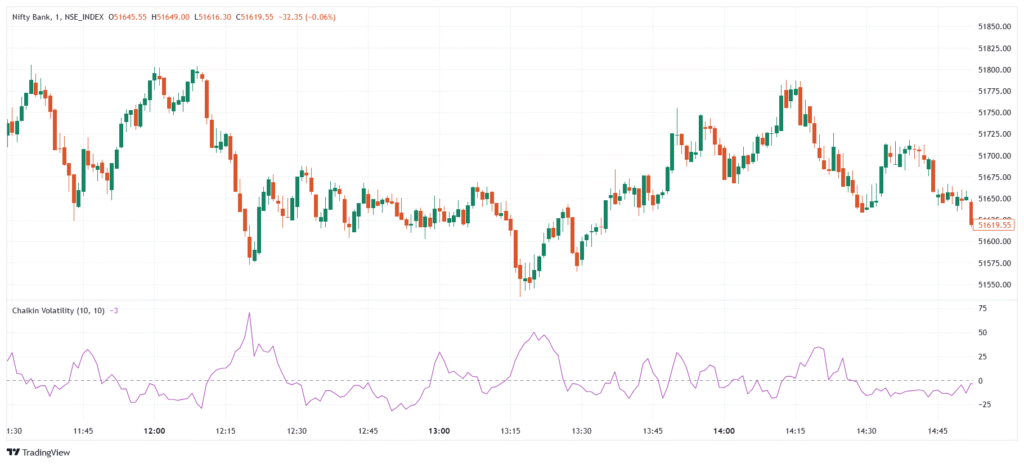
Chaikin Volatility is a volatility indicator developed by Marc Chaikin. It measures the rate of change in the difference between high and low prices over a specific period, typically using a 10-day moving average. Unlike other volatility indicators, it focuses on price range expansion or contraction, not price direction. Traders use it to detect market volatility spikes, breakout setups, and potential trend reversals or continuations.
Significance
- Measures price range expansion to assess market volatility.
- Identifies early signs of breakouts or reversals.
- Highlights periods of contraction, often followed by sharp moves.
- Filters sideways markets by confirming lack of volatility.
- Useful for anticipating volatility shifts before price moves begin.
Indicator Components & Values
- High-Low Range → Difference between high and low prices for each period.
- Moving Average → Typically a 10-period EMA of the high-low range.
- Rate of Change (ROC) → Measures percentage change in the moving average over a set period.
- Rising Chaikin Volatility → Suggests increasing volatility or trend acceleration.
- Falling Chaikin Volatility → Implies decreasing volatility or consolidation.
Trading Strategy
- Breakout Strategy → Watch for a sudden rise in Chaikin Volatility after a period of contraction to confirm breakout strength.
- Trend Reversal Signal → A sharp drop in volatility after a strong trend may hint at trend exhaustion or a reversal.
- Volatility Confirmation → Use with price patterns (e.g., triangles or flags) to confirm breakout validity.
- Chaikin + Bollinger Bands → Combine with Bollinger Band squeeze to identify volatility-based trade setups.
- Chaikin + Trend Indicators → Use alongside indicators like ADX or Supertrend to filter low-volatility signals.
Rate this post
