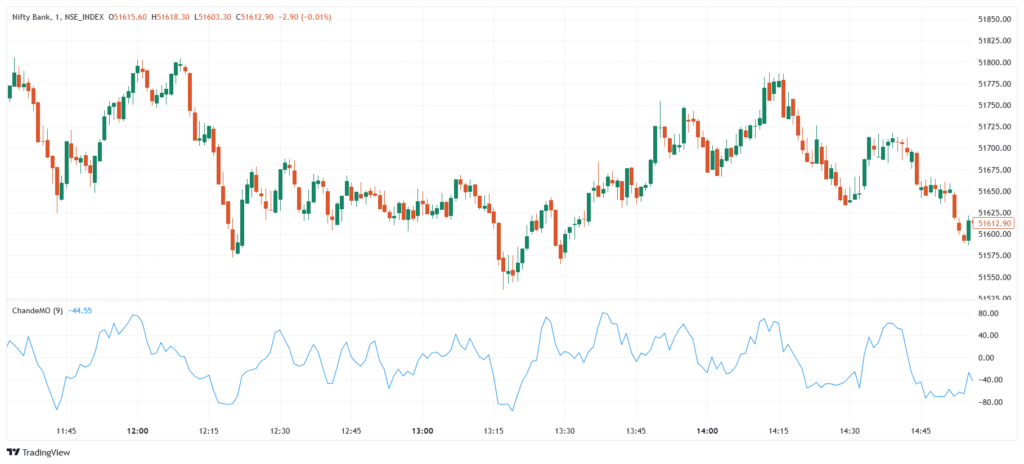
The Chande Momentum Oscillator (CMO) is a technical indicator developed by Tushar Chande to measure price momentum. It considers positive and negative price changes over 14 or 20 days and ranges from -100 to +100. The zero line indicates momentum shifts, helping traders identify trend strength, reversals, and overbought/oversold conditions.
Significance
- Identifies overbought and oversold levels to spot potential trend reversals.
- Measures trend strength to confirm if momentum is increasing or weakening.
- Detects trend reversals when crossing above or below zero.
- More responsive than RSI, making it useful for short-term trading.
- Works well with other indicators like Moving Averages and RSI for better confirmation.
Indicator Components
- CMO Line → Moves between -100 and +100, showing momentum strength.
- Period Range → Commonly 14 or 20 days, adjusting indicator sensitivity.
- Zero Line → Separates bullish (above 0) and bearish (below 0) momentum.
- Overbought & Oversold Levels → Above +50 signals strong buying, below -50 signals strong selling.
- Price Changes → Compares recent gains and losses to determine market momentum.
Trend Strategy
- Overbought & Oversold Strategy → Buy when CMO < -50, sell when CMO > +50.
- Trend Following → Enter long when CMO crosses above 0, enter short when CMO crosses below 0.
- CMO + Moving Average → Trade with the trend when CMO aligns with a 50-MA or 200-MA.
- Divergence Strategy → Buy when price makes a lower low, but CMO makes a higher low (bullish divergence), and sell on the opposite.
- CMO + RSI → Confirm signals with RSI to avoid false momentum shifts.
5/5 - (1 vote)
