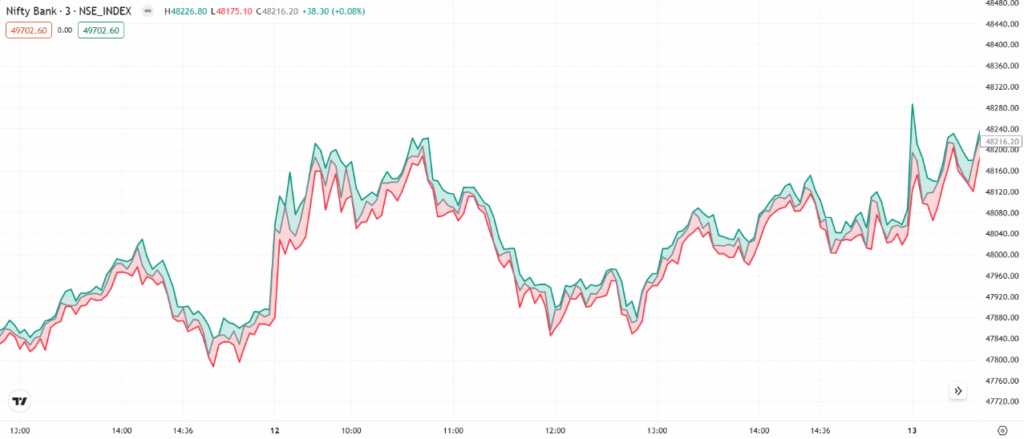
The Column Chart is derived from histograms and bar charts, first introduced in statistical analysis in the 18th century. It is widely used in financial and stock market analysis, where each column represents a specific price or volume over a given period. The London Stock Exchange and Wall Street analysts used column charts extensively in market reports during the 19th and early 20th centuries.
Chart Construction
- Uses vertical bars instead of horizontal bars (like a bar chart).
- Commonly used in volume analysis and financial comparisons.
Importance
- Best for comparing performance of different stocks or trends over time.
- Provides a clear and structured visualization of market data.
- Often used for volume analysis, where each column represents trading volume for a given period.
Limitations
- Not ideal for short-term price analysis.
- Lacks intraday price details such as open, high, and low prices.
Rate this post
