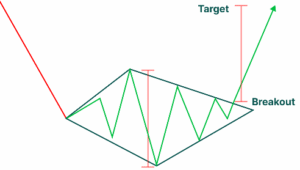
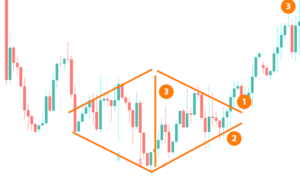
A bullish reversal pattern formed by a diamond-shaped price structure, starting with wide swings and ending with narrowing consolidation; a breakout above the upper boundary signals a strong shift to bullish momentum.
✳️ Pattern Formation
- Forms at the end of a downtrend, where price initially expands and then contracts
- Completion occurs when price breaks out above the upper boundary of the diamond
- Typically seen in volatile markets where reversal is building strength
🔷 Characteristics
- Starts with widening price swings, forming the left half of the diamond
- Followed by narrowing consolidation, forming the right half
- The structure resembles a rhombus or diamond shape on the chart
- Breakout above resistance line confirms a bullish trend shift
🌐 Market Condition
- Best suited for stocks, indices, and commodities experiencing high volatility
- Works well in liquid instruments during bottoming phases
🎯 Trading Strategy
- Enter a long trade once price breaks above the upper diamond boundary.
- Set stop-loss just below the lowest point of recent consolidation.
- Target is calculated by adding diamond height to the breakout price level.

