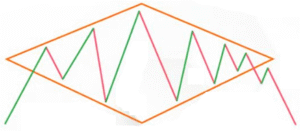
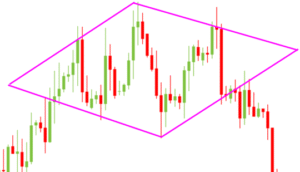
A diamond-shaped formation that occurs after an uptrend, indicating a bearish reversal. This pattern emerges due to increasing price volatility, where the market first expands before consolidating, forming a structure resembling a diamond.
✦ Formation Context
- Forms at the end of an uptrend, where price becomes increasingly volatile.
- Reflects buyer exhaustion, as the trend loses upward strength.
- Indicates early distribution by large players in volatile conditions.
- Commonly appears in high-volume stocks or major indices near tops.
- Reliability increases with a confirmed breakdown and rising volume.
🛠️ Key Visual Features
- Begins with widening price swings forming the left half of the diamond.
- Narrowing consolidation completes the right side of the formation.
- Breakdown happens when price falls below the lower boundary line.
- Volume spikes on breakdown, confirming strong bearish sentiment.
- The full structure forms a symmetrical diamond or broadening top.
🎯 Trading Approach
- Sell when price breaks below support with strong volume confirmation.
- Place stop-loss above the recent consolidation high for protection.
- Target is calculated by subtracting diamond height from breakdown level.
Rate this post

