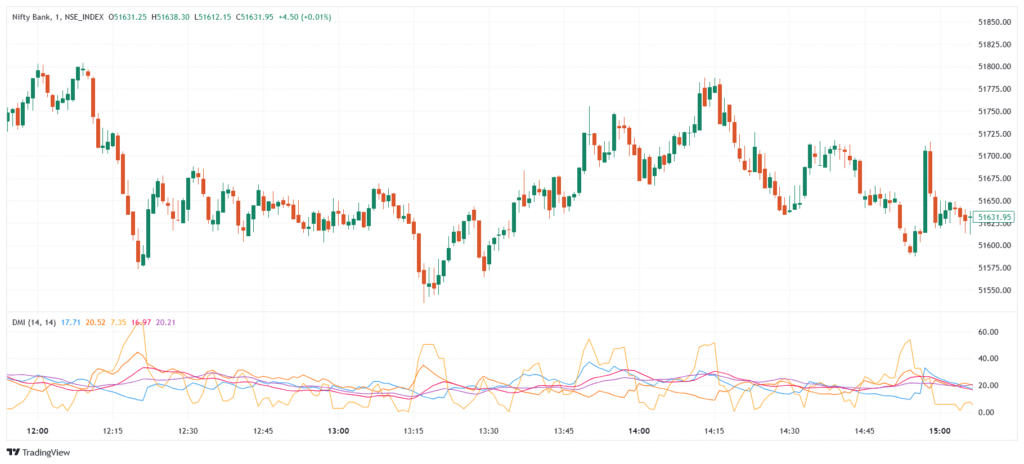
The Directional Movement Index (DMI) is a trend strength indicator developed by J. Welles Wilder Jr. It helps traders determine whether a market is trending and how strong that trend is. The DMI consists of three components: +DI (positive directional indicator), -DI (negative directional indicator), and the ADX (Average Directional Index). While +DI and -DI show the direction of the trend, the ADX measures its strength. Together, they help traders make better decisions on trend-following entries and exits.
💡 Significance
- Identifies trend direction using +DI and -DI crossovers.
- Measures trend strength through the ADX line.
- Distinguishes trending from sideways markets to avoid false signals.
- Supports entry timing when trend direction and strength align.
- Works well with other indicators like Moving Averages and RSI.
📊 Indicator Components & Values
- +DI (Positive Directional Indicator) → Measures strength of upward movement.
- -DI (Negative Directional Indicator) → Measures strength of downward movement.
- ADX (Average Directional Index) → Indicates trend strength (rising ADX = strong trend).
- Crossover Signals →
- +DI crosses above -DI → Possible buy signal.
- -DI crosses above +DI → Possible sell signal.
- ADX Levels →
- Above 25 → Strong trend.
- Below 20 → Weak or no trend.
🎯 Trading Strategy
- Trend Following →
- Buy when +DI crosses above -DI and ADX is rising above 25.
- Sell when -DI crosses above +DI and ADX is rising above 25.
- Filter Sideways Markets → Avoid trades when ADX is below 20.
- DMI + Moving Average → Confirm trend direction with price above/below MA.
- DMI + RSI → Use RSI to confirm momentum during trend signals.
- Early Exit or Reversal → Consider exiting when ADX starts falling or +DI/-DI lines cross back.
