

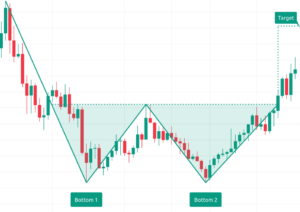
A W-shaped formation where price tests a support level twice at nearly the same level but fails to break lower. This pattern signals a potential trend reversal from a downtrend to an uptrend. It forms after a prolonged bearish trend, and a breakout above the middle peak resistance confirms the bullish reversal.
Significance
- Suggests strong support at a key level, preventing further price decline.
- Indicates buyers are stepping in, absorbing selling pressure and preparing for an uptrend.
- A breakout above the middle peak confirms the trend reversal, signalling buying momentum.

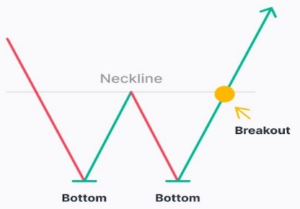

Characteristics
- Two equal or near-equal lows testing the same support level.
- The middle peak (between the two lows) acts as resistance; a breakout confirms the pattern.
- Volume typically declines during formation and rises significantly at breakout.
Market Condition
- Forms after a prolonged downtrend, suggesting a shift in market sentiment.
- More effective when combined with indicators like RSI divergence or MACD bullish crossover.
Trading Strategy
- Entry point – Buy when price breaks above the middle peak (resistance level) with strong volume.
- Stop-loss – Below the second low to protect against false breakouts.
- Target price – Measure the pattern height (distance from the lows to the middle peak) and add it to the breakout level.