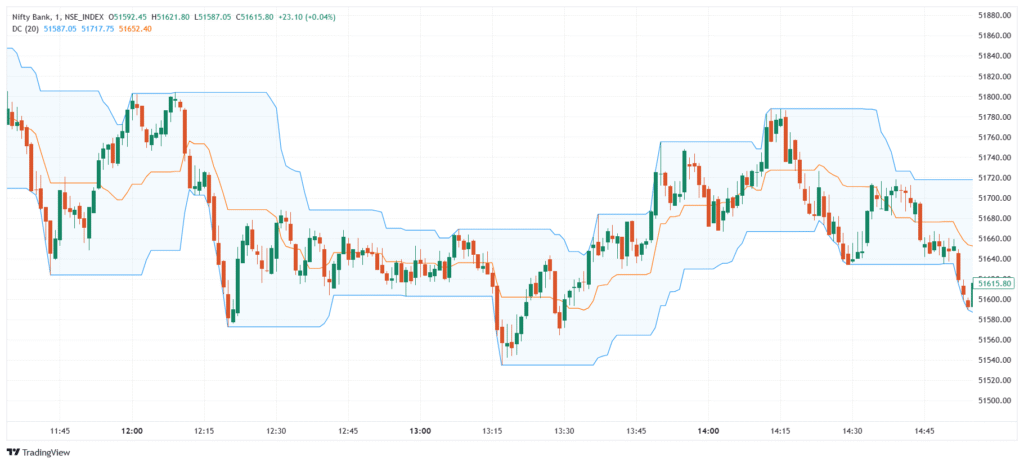
Donchian Channels are a trend-following indicator developed by Richard Donchian, often called the “father of trend following.” The indicator plots three lines: an upper band, a lower band, and a middle line. The upper band shows the highest high, and the lower band shows the lowest low over a selected period (commonly 20 periods). The middle line is the average of the two. Donchian Channels help traders identify breakouts, trend direction, and support/resistance zones.
Significance
- Highlights price breakouts by showing the high-low range over time.
- Helps define trend direction using price position relative to the bands.
- Marks support and resistance levels clearly on the chart.
- Detects volatility expansion through channel widening.
- Used for breakout and trend-trading strategies.
Indicator Components & Values
- Upper Band → Highest price over the chosen period (e.g., 20 days).
- Lower Band → Lowest price over the same period.
- Middle Line → Average of upper and lower bands (optional).
- Channel Width → Expands with volatility and contracts during consolidation.
- Price Relative to Bands →
- Above upper band → Bullish breakout.
- Below lower band → Bearish breakout.
Trading Strategy
- Breakout Strategy →
- Buy when price breaks above the upper band.
- Sell when price breaks below the lower band.
- Trend-Following Strategy → Stay in trade as long as price stays near the outer band.
- Pullback Entry → Enter when price pulls back near the middle line in a strong trend.
- Donchian + Volume → Confirm breakouts with rising volume.
- Donchian + RSI/MACD → Use with momentum indicators to filter false signals and confirm direction.
5/5 - (1 vote)
