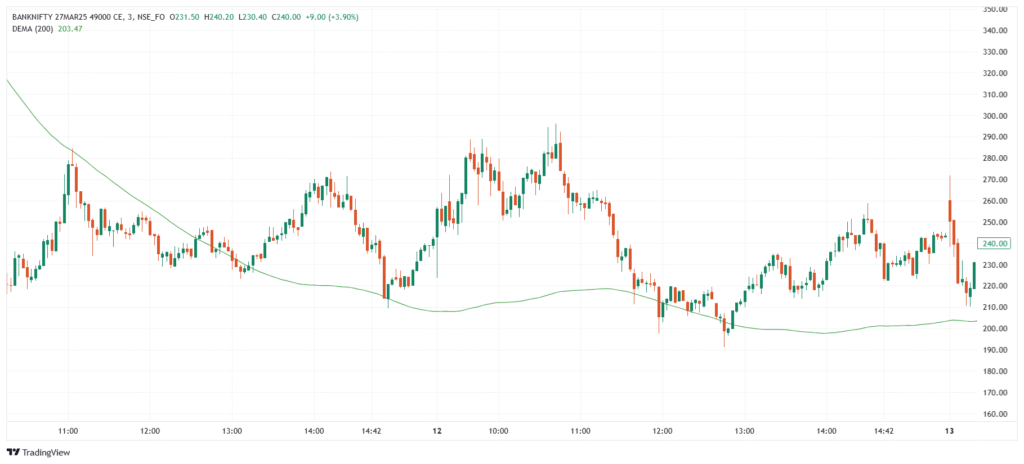
The Double Exponential Moving Average (DEMA) is a trend-following indicator developed by Patrick Mulloy to reduce the lag found in traditional moving averages. It combines a single EMA and a smoothed EMA of the EMA, producing a line that reacts more quickly to price changes while maintaining smoothness. DEMA is widely used to spot trend direction, generate early trade signals, and improve the timing of entries and exits.
💡 Significance
- Faster than EMA, helping traders catch trends earlier.
- Reduces lag significantly while remaining smooth and readable.
- Improves entry/exit timing in trending or volatile markets.
- Adapts well to short- and medium-term trading strategies.
- Pairs well with other technical indicators like RSI or MACD for confirmation.
📈 Indicator Components & Values
- DEMA Line → Combines an EMA and an EMA of EMA to form a responsive trend line.
- Common period → Usually set to 20 or 21, but adjustable.
- Smoother than EMA, but more reactive than SMA.
- No fixed zones → Signal comes from slope and price relation.
- Trend direction → Rising DEMA suggests uptrend; falling DEMA suggests downtrend.
🎯 Trading Strategy
- Trend Direction Strategy → Buy when price is above DEMA and it’s sloping upward; sell when below DEMA and it’s sloping downward.
- Crossover Strategy → Use with another moving average (e.g., SMA or EMA); DEMA crossing above = buy, below = sell.
- Pullback Entry → Buy dips to DEMA during uptrends; sell rallies to DEMA in downtrends.
- DEMA + RSI → Confirm entries by checking if RSI aligns with DEMA trend.
- Trailing Stop Strategy → Use DEMA as a dynamic stop-loss line in trending trades.
