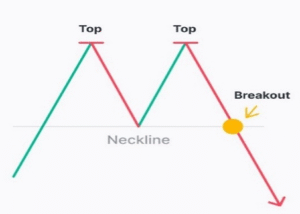
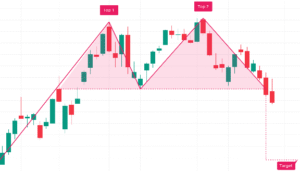
A M-shaped pattern where price tests resistance twice at nearly the same level but fails to break higher. This pattern signals that buyers are losing strength, and a breakdown below support confirms a bearish trend reversal.
💡 Significance
- Suggests that strong resistance is preventing further price increases.
- Indicates a shift in market sentiment from bullish to bearish.
- A breakout below support confirms the reversal and signals selling pressure.
✳️ Formation Context
- Develops during an uptrend, when price tests the same resistance level twice
- Pattern completes when price breaks below the intermediate trough (neckline)
- Commonly appears during the distribution phase, indicating declining buyer interest
🔷 Characteristics
- Two peaks form near the same price level, showing strong resistance
- Trough between the peaks acts as a neckline and potential support
- Breakdown below neckline confirms the bearish reversal
- Volume often decreases on the second peak and rises on breakdown
🌐 Market Condition
- Most effective in equity and index markets during overbought or extended bullish phases
- Best suited for liquid instruments showing signs of trend fatigue
🎯 Trading Strategy
- Enter short once price closes below the support with volume confirmation.
- Set stop-loss just above the second peak to limit potential loss.
- Target is calculated by subtracting pattern height from breakdown level.
Rate this post

