

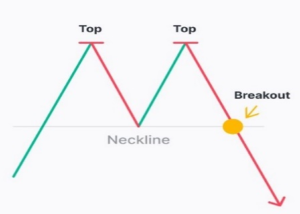
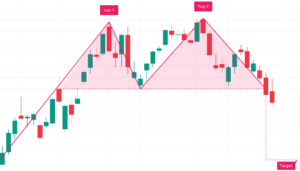
A M-shaped pattern where price tests resistance twice at nearly the same level but fails to break higher. This pattern signals that buyers are losing strength, and a breakdown below support confirms a bearish trend reversal.
Significance
- Suggests that strong resistance is preventing further price increases.
- Indicates a shift in market sentiment from bullish to bearish.
- A breakout below support confirms the reversal and signals selling pressure.


Characteristics
- Two equal highs testing a key resistance level.
- Breakout occurs when price drops below the middle support between peaks.
- Volume declines at the second peak and rises on the breakdown.
Market Condition
- Forms after a prolonged uptrend, signalling that the trend is weakening.
- More effective when accompanied by decreasing momentum indicators.
Trading Strategy
- Entry point – Short when price breaks below the support
- Stop-loss – Above the second peak to limit losses.
- Target price – Measure the pattern height and subtract it from the breakdown level.