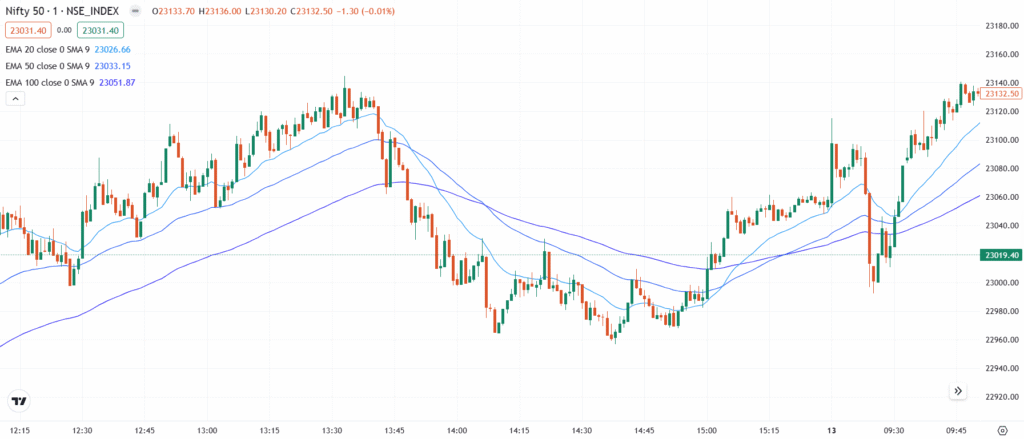
The Exponential Moving Average (EMA) is a trend-following indicator that gives more weight to recent prices, making it more responsive than the Simple Moving Average (SMA). It helps smooth out price fluctuations and highlights the direction of the trend. The EMA is widely used in both short-term and long-term trading to identify trend reversals, entry/exit points, and dynamic support or resistance.
💡 Significance
- Responds faster to recent price changes than SMA.
- Identifies trend direction more clearly in real-time markets.
- Provides support/resistance zones in trending markets.
- Useful for early entries/exits in momentum trading.
- Widely used in combination with other indicators like MACD or RSI.
📊 Indicator Components & Values
- EMA Line → Smooth curved line plotted based on weighted price averages.
- Lookback Period → Commonly 9, 20, 50, or 200 periods, depending on strategy.
- Recent price weighting → Makes EMA more reactive to new price movements.
- Slope of EMA → Upward slope = uptrend, downward slope = downtrend.
- Crossover signals → EMA crossovers with price or other EMAs signal entries or exits.
🎯 Trading Strategy
- Price Crossover Strategy →
- Buy when price crosses above the EMA.
- Sell when price crosses below the EMA.
- EMA Crossover Strategy →
- Buy when a short-term EMA (e.g., 9) crosses above a long-term EMA (e.g., 21).
- Sell when it crosses below.
- EMA + RSI → Use EMA trend as direction filter and RSI for timing entries.
- Support/Resistance Strategy → Use EMA as a dynamic level for pullback entries.
- Trailing Stop → Use EMA as a trailing stop in strong trends.
