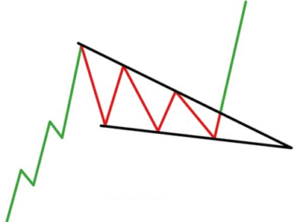
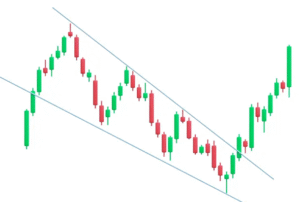
A bullish reversal pattern that forms when the price moves lower within a narrowing downward-sloping channel. This pattern indicates that selling pressure is weakening, and a breakout to the upside is likely. It signals that buyers are gradually taking control, leading to a potential trend reversal from a downtrend to an uptrend.
💡Significance
- Suggests that sellers are losing strength, as price fails to make significantly lower lows.
- Indicates buyer accumulation, as price moves within a narrowing range.
- A breakout above the wedge confirms the trend reversal, signalling a shift to bullish momentum.
✳️ Formation Context
- Forms during a prolonged downtrend, where price declines slow down with tighter ranges
- Develops as price compresses downward within narrowing trendlines
- Indicates buyer accumulation while sellers gradually lose control
🔷 Characteristics
- Lower highs and lower lows form two converging downward trendlines
- Volume typically contracts throughout the wedge and rises at breakout
- Breakout above the upper trendline confirms a bullish reversal
- Pattern often completes near the apex of the wedge
🌐 Market Condition
- Suited for declining or oversold markets showing early signs of reversal
- Effective in stocks, indices, and forex during bottoming phases
🎯 Trading Strategy
- Entry Point: Buy when price breaks above the upper trendline with strong volume
- Stop-loss: Set below the last swing low inside the wedg
- Target Price: Measure the widest height of the wedge and add to breakout level

