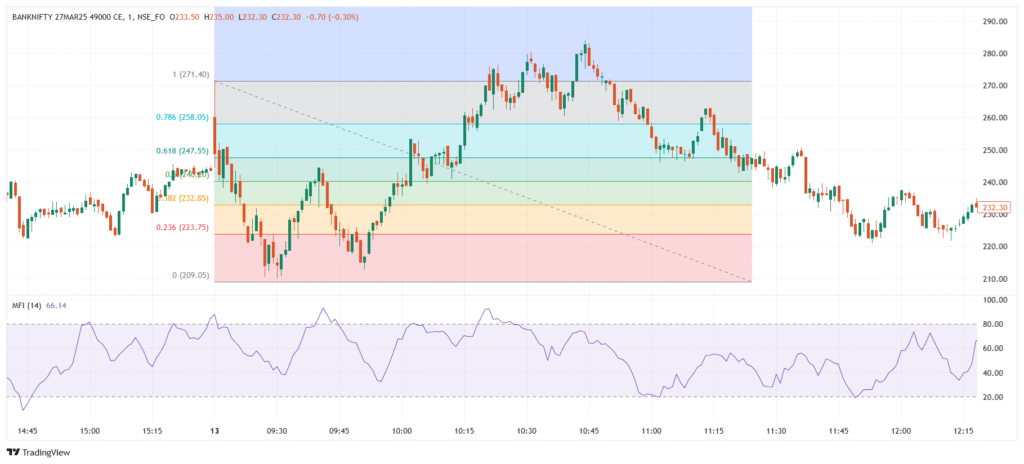
Fibonacci Retracement is a popular technical analysis tool used to identify potential support and resistance levels during a trend. It is based on the Fibonacci sequence, particularly the key ratios: 23.6%, 38.2%, 50%, 61.8%, and 78.6%. These levels are plotted between a significant high and low, and traders use them to anticipate possible pullbacks or reversal points in price before the trend continues. It is widely used in trending markets to predict corrections and time entries or exits.
💡 Significance
- Identifies possible retracement zones during uptrends or downtrends.
- Helps find support and resistance levels within ongoing trends.
- Used to time entries on pullbacks or exits near reversal points.
- Applies across all timeframes, from intraday to long-term trading.
- Combines well with other tools like moving averages, trendlines, or candlestick patterns.
📊 Indicator Components & Levels
- Retracement Levels (percentage of prior move):
- 6% – shallow retracement, often in strong trends.
- 2% and 50% – common retracement zones.
- 8% – the “golden ratio,” often marks strong support/resistance.
- 6% – deep retracement, often near reversal.
- Anchor Points → Plotted from a swing high to low (in a downtrend) or low to high (in an uptrend).
- Price Reaction Zones → Price often stalls, reverses, or bounces near these levels.
🎯 Trading Strategy
- Pullback Entry → Enter trades when price retraces to a key Fibonacci level (like 38.2% or 61.8%) and shows signs of continuation.
- Reversal Signal → Look for price rejection or reversal candlestick patterns at deeper levels (e.g., 61.8% or 78.6%).
- Fibonacci + Trendlines → Use Fibonacci levels alongside trendlines for confluence.
- Fibonacci + RSI or MACD → Confirm retracement setups with momentum indicators.
- Target Setting → Use Fibonacci extensions (like 127.2%, 161.8%) to project profit targets after a retracement.
