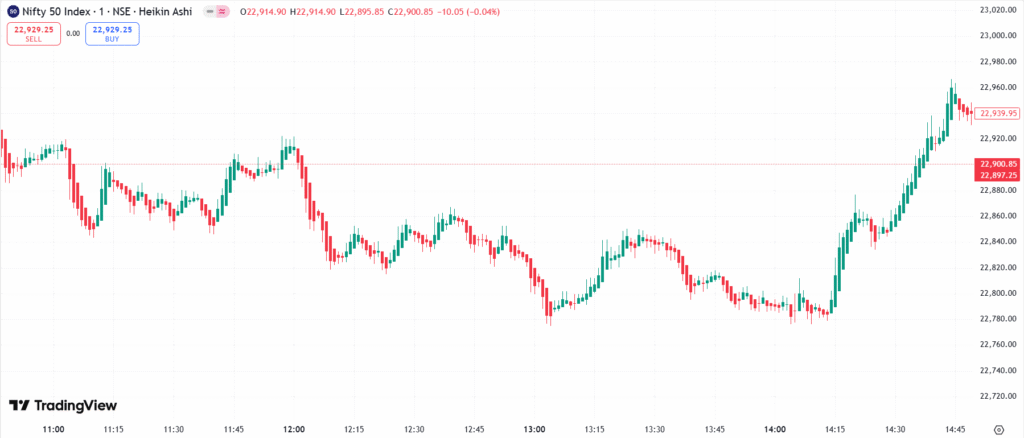
The Heikin-Ashi Chart (meaning “average bar” in Japanese) is a modified candlestick chart developed by Japanese traders. It smooths out price movements by averaging price data, making trends easier to identify. Heikin-Ashi charts help traders filter market noise, stay in trends longer, and confirm reversals more clearly.
Chart Construction
- Similar to candlestick charts but smooths out trends by averaging prices:
- Open = (Previous Open + Previous Close) / 2
- Close = (Open + High + Low + Close) / 4
- Helps traders eliminate minor price fluctuations for clearer trend direction.
Importance
- Helps traders stay in trends longer by filtering out minor pullbacks.
- Reduces noise, making it easier to identify strong trends.
- Useful for swing trading and trend-following strategies.
Limitations
- The actual price is not accurately represented due to averaging.
- Less effective in sideways or consolidating markets.
Rate this post
