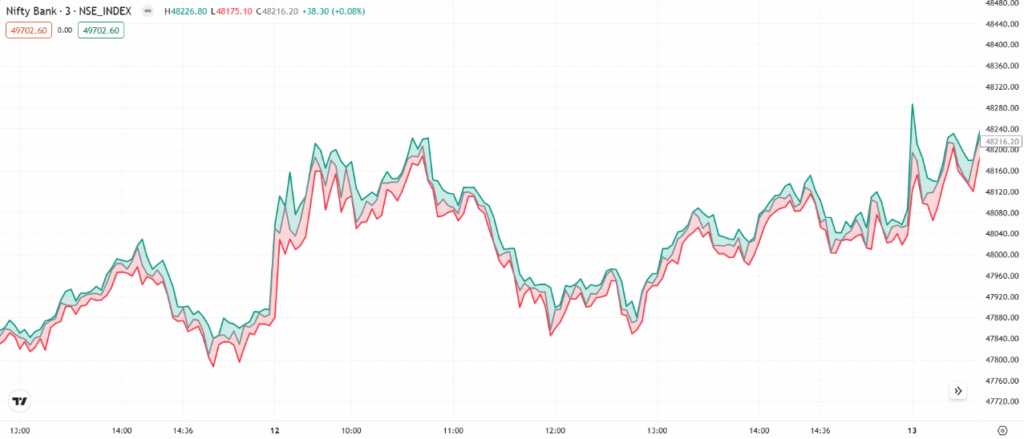
The HLC (High-Low-Close) Area Chart is a variation of the Area Chart, enhanced in modern stock analysis platforms. It displays the highest, lowest, and closing prices within a given period while shading the area to emphasize market movement. HLC charts help traders assess price volatility and key market levels with a simplified view.
Chart Construction
- Focuses only on the highest and lowest prices for each period.
- Eliminates open and close prices, emphasizing volatility
Importance
- Provides a clear view of price fluctuations while keeping the chart simple.
- Useful for long-term trend analysis while still including intraday volatility.
- Helps traders and investors quickly grasp price range movements.
Limitations
- Lacks opening price data, which can be crucial for some trading strategies.
- Can become cluttered when used with too many data points.
Rate this post
