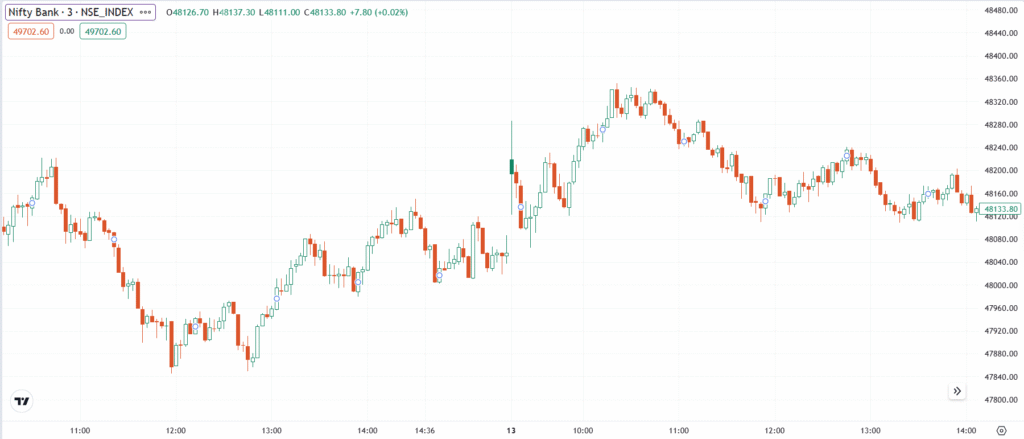
The Hollow Candlestick Chart is a variation of the traditional Candlestick Chart, derived from Japanese trading techniques. It enhances market sentiment analysis by making bullish candles hollow (empty) and bearish candles filled. This format helps traders easily distinguish strong trends from weaker price movements, improving momentum-based trading strategies.
Chart Construction
- Works like a candlestick chart but with a hollow/filled body:
- Hollow (empty) candle = Bullish move (Close > Open).
- Filled (solid) candle = Bearish move (Close < Open).
- Helps traders visualize momentum better than regular candlesticks.
Importance
- Enhances trend clarity by distinguishing strong bullish and bearish movements.
- Helps traders filter out short-term fluctuations in volatile markets.
- Useful for momentum trading and breakout analysis.
Limitations
- Less commonly used, so fewer traders are familiar with its interpretation.
- Can sometimes be confusing for beginners who are used to standard candlestick charts.
Rate this post
