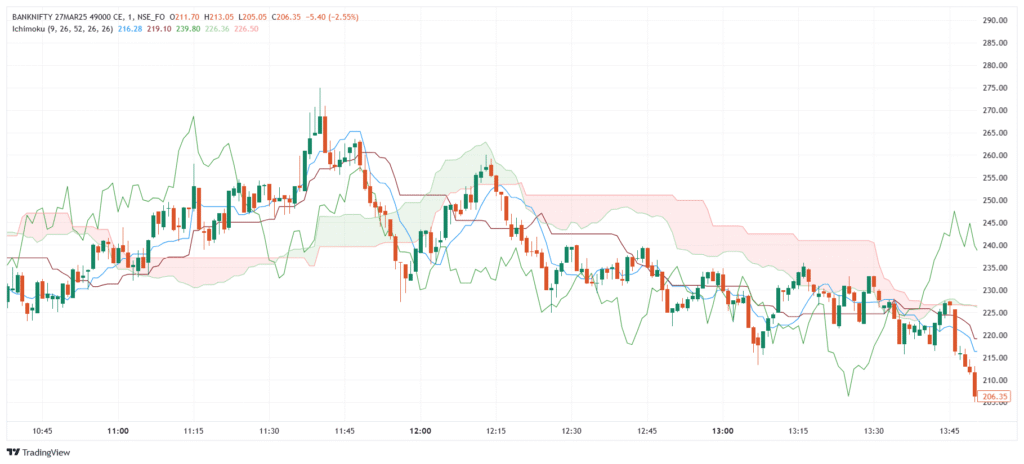
The Ichimoku Cloud, or Ichimoku Kinko Hyo, is a complete trend-following indicator developed by Goichi Hosoda, a Japanese journalist, in the 1930s. It gives a broad view of price action, including trend direction, support/resistance, momentum, and entry/exit signals—all in one chart. The “cloud” (Kumo) is the shaded area between two lines and shows future support/resistance zones and market strength.
💡 Significance
- Shows trend direction through price position relative to the cloud.
- Identifies support/resistance using the cloud and key lines.
- Gives early signals through crossovers and cloud twists.
- Displays momentum/consolidation in one visual setup.
- Useful across timeframes, from scalping to swing trading.
📊 Indicator Components & Values
- Tenkan-sen (Conversion Line) = (9-period high + 9-period low) ÷ 2
- Short-term trend guide.
- Kijun-sen (Base Line) = (26-period high + 26-period low) ÷ 2
- Mid-term trend/resistance level.
- Senkou Span A = (Tenkan-sen + Kijun-sen) ÷ 2
- First cloud edge, projected 26 periods ahead.
- Senkou Span B = (52-period high + 52-period low) ÷ 2
- Second edge, also projected forward.
- Chikou Span (Lagging Line) = Current close plotted 26 periods back
- Confirms trend and support.
- Kumo (Cloud) = Area between Span A and B
- Thick cloud = Strong trend; Thin cloud = Weak zone
- Price above cloud = Bullish, below = Bearish, inside = Neutral
🎯 Trading Strategy
- Trend Strategy → Buy when price is above cloud, and Tenkan crosses Kijun. Sell when price is below cloud with bearish crossover.
- Breakout Strategy → Enter when price breaks cloud with confirmation and rising Chikou Span.
- Kumo Twist Signal → Span A crossing Span B hints early trend change.
- Chikou Confirmation → Lagging line must support the trend (above/below price).
- Stop-loss & Target → Use cloud edges or Kijun-sen for stop; recent highs/lows for targets.
