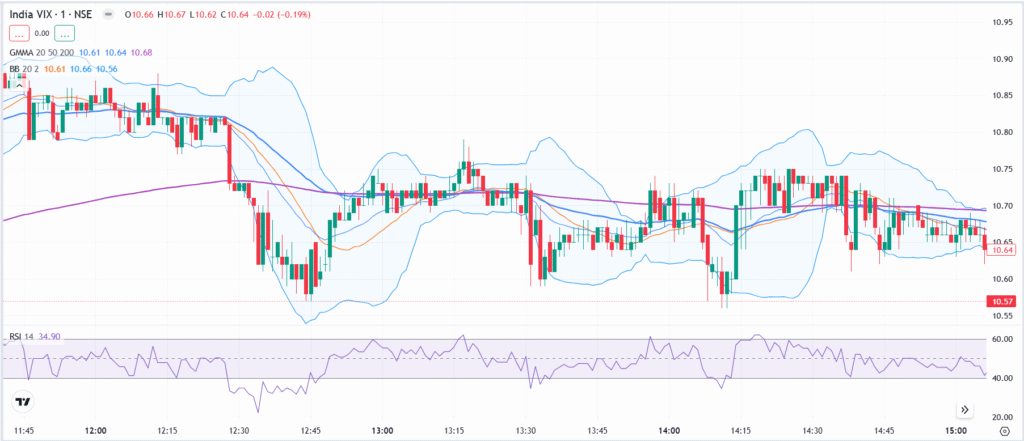
India VIX, or the India Volatility Index, is widely known as the “fear gauge” of the Indian equity market. It reflects the market’s expectation of annualized volatility in the NIFTY 50 over the next 30 calendar days, derived from real-time option prices. A rising India VIX signals that traders anticipate **larger price swings—up or down—**while a lower reading points to market calm and stability. Unlike price-based indicators, it is forward-looking, helping investors measure the intensity of future market moves rather than their direction.
💡 Significance and Importance
- Market Mood Thermometer: Instantly captures collective investor sentiment and risk appetite.
- Risk-Management Tool: Guides portfolio hedging, stop-loss placement, and position sizing.
- Option Pricing Insight: Directly impacts implied volatility, which drives option premiums.
- Contrarian Indicator: Extreme highs often coincide with market panic and potential bottoms, while very low readings can precede sharp breakouts.
🔷 Key Characteristics
- Forward-Looking: Projects expected volatility for the next 30 days, not historical moves.
- Non-Directional: Indicates the magnitude of potential movement, not whether prices will rise or fall.
- Mean-Reverting: After large spikes or dips, it tends to return toward a long-term average.
- Options-Driven: Computed entirely from live NIFTY option prices across multiple strike levels.
🧮 Calculation Method & Key Inputs
India VIX is calculated using a reverse-engineered option-pricing approach, similar to the U.S. CBOE VIX, to capture the market’s 30-day expected volatility.
Key Inputs
- Strike Price: Prices of out-of-the-money (OTM) NIFTY options used for the computation.
- Forward Index Level: Current or implied future NIFTY level, generally taken from NIFTY futures.
- Time to Expiry: Minutes or days remaining until the option’s expiry.
- Risk-Free Rate: Annualized yield on government securities that match the option’s maturity.
- Bid–Ask Quotes: Best bid and ask prices of selected NIFTY options.
- Implied Volatility: Market-expected volatility extracted from option premiums.
Process
The NSE model selects near- and next-month OTM NIFTY calls and puts, calculates individual implied volatilities from their best bid–ask quotes, and aggregates them into a single annualized volatility percentage reported as India VIX. Because option prices and liquidity change constantly, the index updates in real time.
🔑 Interpretation of Values
The India VIX value is expressed as an annualized percentage, derived from the implied volatility of NIFTY 50 option premiums.
- It represents the market’s expectation of how much the NIFTY index might fluctuate—up or down—over the next 30 calendar days.
- To estimate the expected monthly move, divide the VIX value by √12.
Example: A VIX of 24 implies about a 7% expected move (24 ÷ √12) in either direction for the month.
| India VIX Range | Market Sentiment | Trading Implication |
| Below 12 | Very calm | Option premiums low; buying straddles/strangles can be attractive if a breakout is expected. |
| 12–18 | Normal | Trend strategies work; moderate hedging. |
| 18–25 | Elevated caution | Portfolio hedges recommended; option sellers can collect higher premiums. |
| 25–35 | High anxiety | Big swings likely; short-term traders tighten stops. |
| Above 35 | Extreme fear | Often accompanies market capitulation; contrarian long opportunities may emerge after confirmation. |
These ranges are guidelines—context such as global events, liquidity, and market trends can shift their meaning.
📜 Historical Evidence and Key Spikes
- 2008 Global Financial Crisis: India VIX soared to nearly 85 as global markets plunged.
- 2013 Taper Tantrum: Jumped above 40 when the U.S. Federal Reserve hinted at reducing monetary stimulus.
- March 2020 COVID-19 Crash: Surged past 80 during sudden worldwide lockdowns and panic selling.
- Typical Calm Periods (2017–2019): Hovered between 11 and 15 amid steady economic growth.
Such spikes typically result from unexpected macro shocks—global crises, geopolitical conflicts, or abrupt policy changes—that trigger fear and sharp market moves.
🏁 Concluding Insights
India VIX is more than an NSE number—it’s a key gauge of sentiment and expected turbulence.
- High VIX signals rough markets, favoring hedging or selective option selling.
- Low VIX shows calm, opening opportunities for long volatility trades.
- Pairing VIX with RSI, EMA, Bollinger Bands, or MACD gives a sharper view of volatility momentum.
- Reading these alongside NIFTY price and option-chain data helps traders anticipate swings, manage risk, and fine-tune entries and exits.
