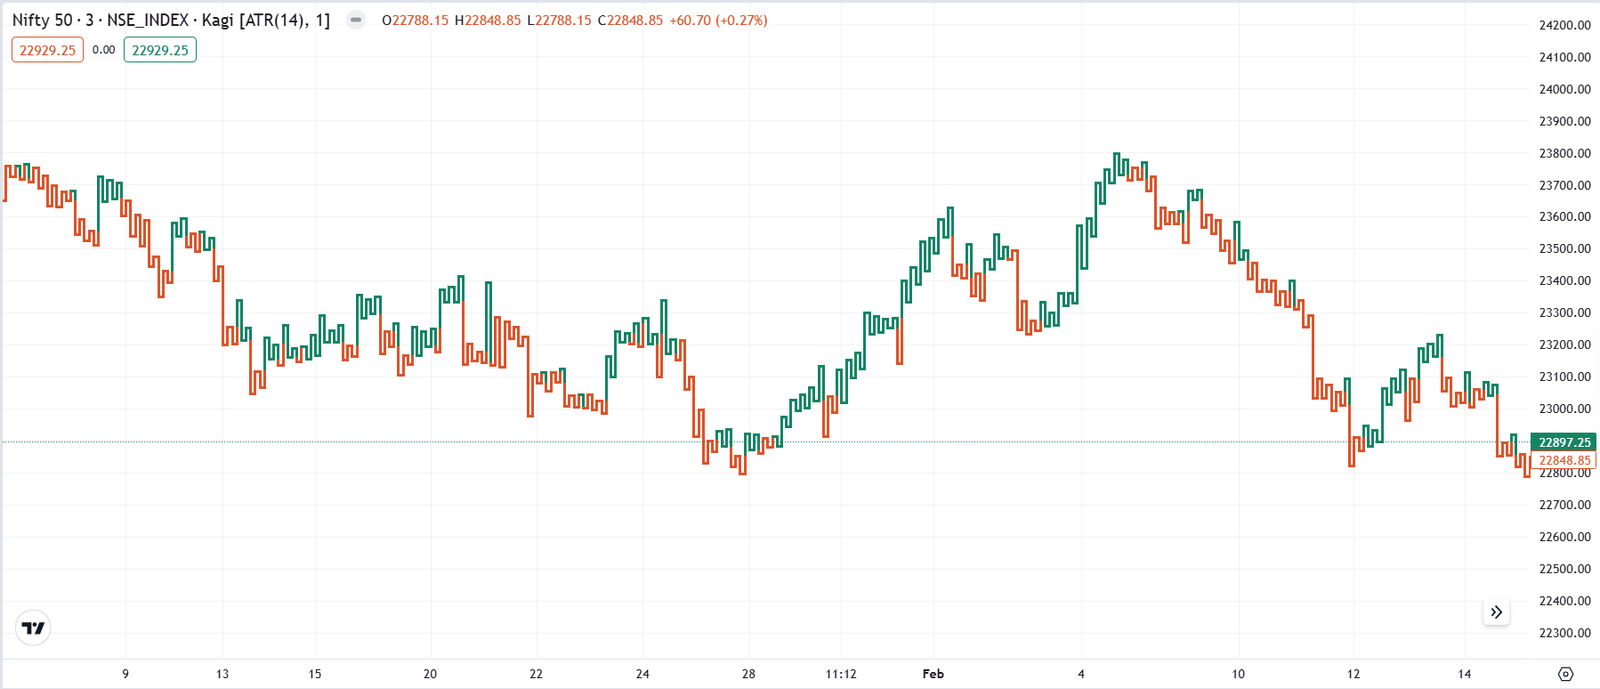
The Kagi chart was developed in Japan during the 19th century and introduced to the Western world by Steve Nison, the author of “Japanese Candlestick Charting Techniques.” It is a trend-following chart that changes direction based on significant price reversals. A thick line represents a bullish trend, while a thin line represents a bearish trend.
Importance
- Helps traders identify breakout levels and major trend reversals.
- Filters out minor price movements, reducing false signals.
- Best used for trend-based trading strategies.
Limitations
- Not commonly used by retail traders.
- Can be difficult to interpret for beginners.