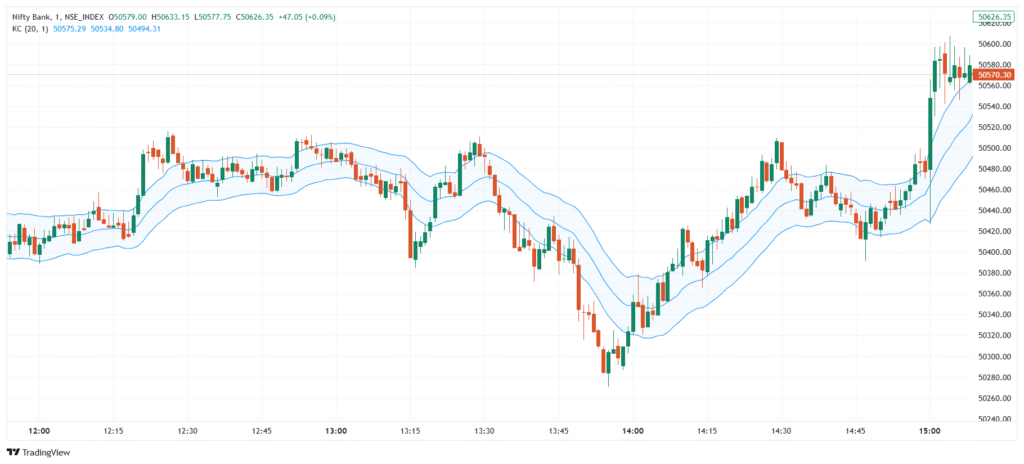
Keltner Channels are a volatility-based indicator developed by Chester Keltner and later refined by Linda Raschke. They consist of a central line (usually a 20-period EMA) and upper/lower bands set at a multiple (commonly 2×) of the Average True Range (ATR). Unlike Bollinger Bands, which use standard deviation, Keltner Channels use ATR to define band width and help identify trend direction, breakouts, and price extremes.
💡 Significance
- Measures volatility using ATR to set channel width.
- Identifies trend direction when price consistently stays near one band.
- Signals potential breakouts when price moves outside the channel.
- Helps detect overbought and oversold levels within a trend.
- Works well with trend and momentum indicators like RSI, MACD, and Moving Averages.
📊 Indicator Components & Values
- Middle Line → 20-period Exponential Moving Average (EMA).
- Upper Band → EMA + (Multiplier × ATR), shows resistance or overbought level.
- Lower Band → EMA − (Multiplier × ATR), shows support or oversold level.
- ATR Multiplier → Commonly set to 2× ATR, adjustable for sensitivity.
- Channel Width → Expands or contracts based on market volatility.
🎯 Trading Strategy
- Trend Continuation Strategy → Buy when price holds near or above the upper band; sell when near or below the lower band.
- Breakout Strategy → Enter trades when price closes outside the channel, expecting trend continuation.
- Reversal Strategy → Look for reversal signals when price touches the outer band and fails to break through.
- Keltner + RSI → Confirm overbought/oversold signals using RSI when price touches the bands.
- Keltner + Moving Average → Use a longer-term MA (e.g., 50 or 200 EMA) to confirm the overall trend direction.
Rate this post
