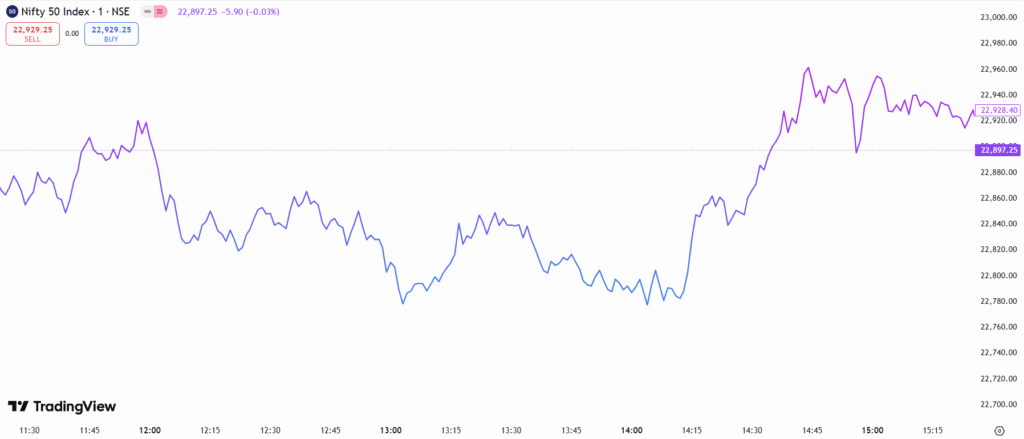
The Line Chart is one of the earliest financial charts, used since the 19th century for market analysis. It connects closing prices over time with a continuous line, offering a clear view of trends while filtering out minor fluctuations. Though its exact inventor is unknown, it has been a key tool in technical and economic analysis for over a century.
Chart Construction
- Plots only the closing price for each period (daily, weekly, etc.).
- Each closing price is connected with a continuous line.
- Ignores opening, high, and low prices, making it simple to identify trends.
Importance
- Best for identifying long-term trends in price movements.
- Helps traders get a quick overview of market direction.
- Reduces market noise, making it easier to spot trends.
Limitations
- Lacks details such as opening, high, and low prices.
- Not useful for short-term trading or price pattern analysis.
Rate this post
