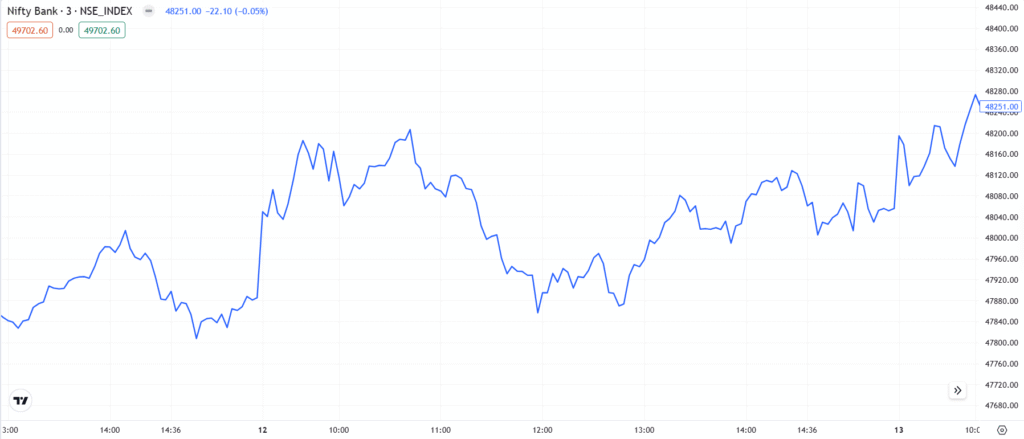
A Line Chart with Markers is an enhanced version of the traditional line chart, where key data points are emphasized using dots, circles, or symbols. This style became popular in financial journalism and technical analysis tools in the late 20th century, as digital charting systems allowed for interactive visualization. It was widely adopted by Bloomberg Terminal, Reuters, and stock market software to highlight key price movements.
Chart Construction
- Works like a line chart, but with dots or symbols marking specific price points.
- Helps highlight important data points such as daily highs or earnings reports.
Importance
- Helps traders easily identify specific price points on the chart.
- Enhances readability in financial reports and presentations.
- Useful for comparing stock movements across multiple timeframes.
Limitations
- Can become overcrowded with too many data points.
- Not as effective for detailed technical analysis compared to candlestick charts.
Rate this post
