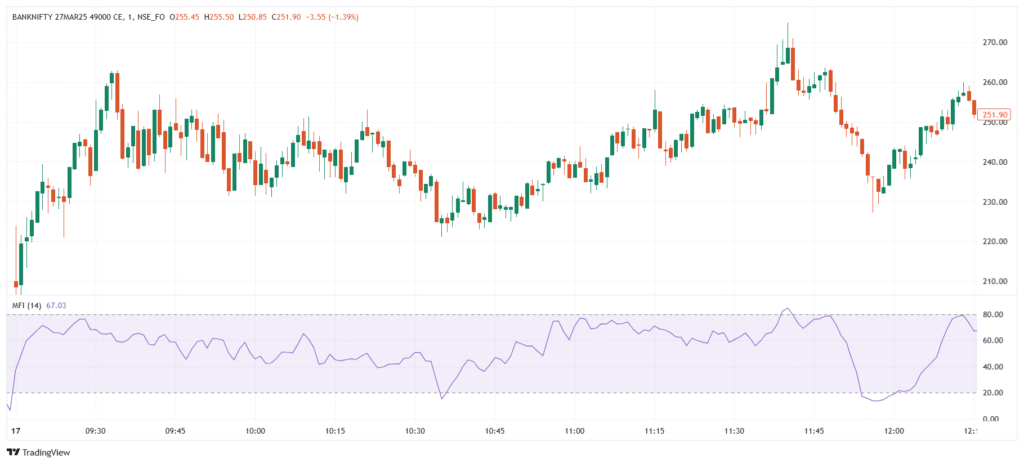
The Money Flow Index (MFI) is a momentum and volume-based oscillator that measures the flow of money into and out of an asset over a specific period, typically 14 periods. Often called the volume-weighted RSI, it uses both price and volume data to identify overbought and oversold conditions. MFI values range from 0 to 100, with readings above 80 suggesting overbought conditions and below 20 suggesting oversold. It helps traders confirm trends, spot reversals, and detect potential price strength or weakness.
Significance
- Identifies overbought and oversold conditions using price and volume.
- Measures money flow strength, not just price movement.
- Confirms price trends when MFI moves in line with price.
- Detects reversals through divergence between MFI and price.
- More reliable than RSI in volume-sensitive markets.
Indicator Components & Values
- MFI Line → Oscillates between 0 and 100, showing strength of money flow.
- Overbought Level → Above 80, potential selling signal.
- Oversold Level → Below 20, potential buying signal.
- Typical Price → Average of high, low, and close; used in the MFI formula.
- Money Flow → Typical Price × Volume; used to calculate the ratio of positive and negative flows.
Trading Strategy
- Overbought & Oversold Strategy → Sell when MFI > 80, buy when MFI < 20.
- Trend Confirmation → Trade in the trend direction when MFI supports price movement.
- Divergence Strategy → Buy when price makes a lower low and MFI makes a higher low; sell on the opposite setup.
- MFI + Moving Average → Combine with MA to confirm trend strength and entry points.
- MFI + MACD/RSI → Use MFI with other momentum indicators to validate signals and reduce false entries.
Rate this post
