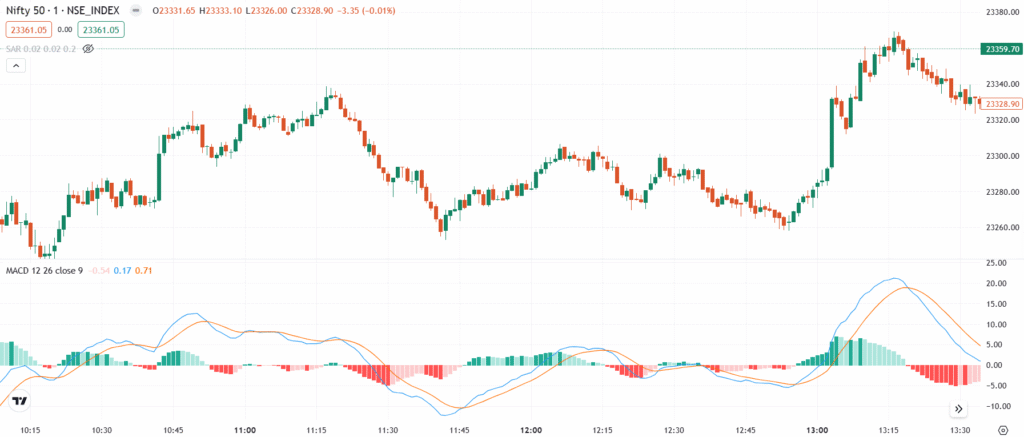
The Moving Average Convergence Divergence (MACD) is a momentum indicator that helps traders identify trend direction, strength, and potential reversals. It is based on the relationship between two moving averages and is commonly used for spotting buy and sell opportunities in the market.
Significance
- Trend Identification: Determines uptrend or downtrend based on the MACD line.
- Works best in trending markets, less effective in sideways markets.
- Momentum Strength: Histogram indicates trend strength.
Indicator Components
- MACD Line (Fast Line)
- Formula: MACD Line = 12-day EMA − 26-day EMA
- This line represents the difference between the short-term (12-day) and long-term (26-day) exponential moving averages (EMAs).
- If the MACD line crosses above zero, it signals bullish momentum, and if it crosses below zero, it signals bearish momentum.
- Signal Line (Slow Line)
- Formula: 9-day EMA of MACD Line
- It smooths out the MACD line and helps identify signals for buying and selling.
- A bullish signal occurs when the MACD line crosses above the signal line, while a bearish signal occurs when it crosses below.
- MACD Histogram
- Formula: MACD Histogram = MACD Line − Signal Line
- The histogram shows the difference between the MACD line and the signal line.
- A rising histogram suggests increasing bullish momentum, while a declining histogram suggests increasing bearish momentum.
Trading Strategy
- Buy & Sell Signals:
- Bullish Crossover: MACD line crosses above signal line → Buy
- Bearish Crossover: MACD line crosses below signal line → Sell
- Zero Line Crossover:
- MACD above zero → Bullish trend
- MACD below zero → Bearish trend
- Divergence Analysis:
- Bullish Divergence: Price makes a new low, but MACD makes a higher low → Trend reversal upward
- Bearish Divergence: Price makes a new high, but MACD makes a lower high → Trend reversal downward
5/5 - (1 vote)
