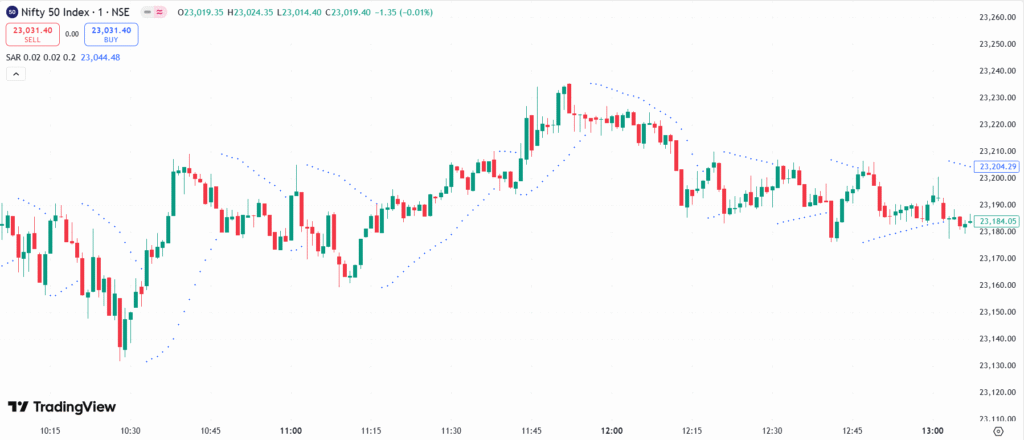
The Parabolic SAR is a trend-following indicator by J. Welles Wilder Jr. It places dots below the price in an uptrend (buy signal) and above the price in a downtrend (sell signal). As the trend moves, the SAR follows, helping traders identify trend direction, reversals, and stop-loss levels. It is most effective in strong trends and works well with other indicators.
💡 Significance
- Identifies trend direction with dots above (downtrend) or below (uptrend) the price.
- Signals trend reversals when SAR dots switch sides.
- Helps set stop-loss levels as the SAR moves with the trend.
- Best for trending markets, providing clear trade signals.
- Works well with indicators like Moving Averages and RSI.
📊 Indicator Components & Values
- SAR Dots → Appear above price in a downtrend, below in an uptrend.
- Acceleration Factor (AF) → Starts at 02, increases to 0.20 as the trend strengthens.
- Trend Direction → Below price = uptrend, above price = downtrend.
- Stop and Reverse Mechanism → SAR flips when price touches the dot.
🎯 Trading Strategy
- Trend Following → Buy when SAR is below price, sell when SAR is above price.
- SAR + Moving Average → Trade in the direction of the 50-MA or 200-MA.
- SAR + RSI → Buy when SAR signals uptrend and RSI is above 50, sell when below 50.
- SAR + MACD → Confirm trades when SAR aligns with MACD crossovers.
- Trailing Stop-Loss → Use SAR dots as dynamic stop-loss levels.
