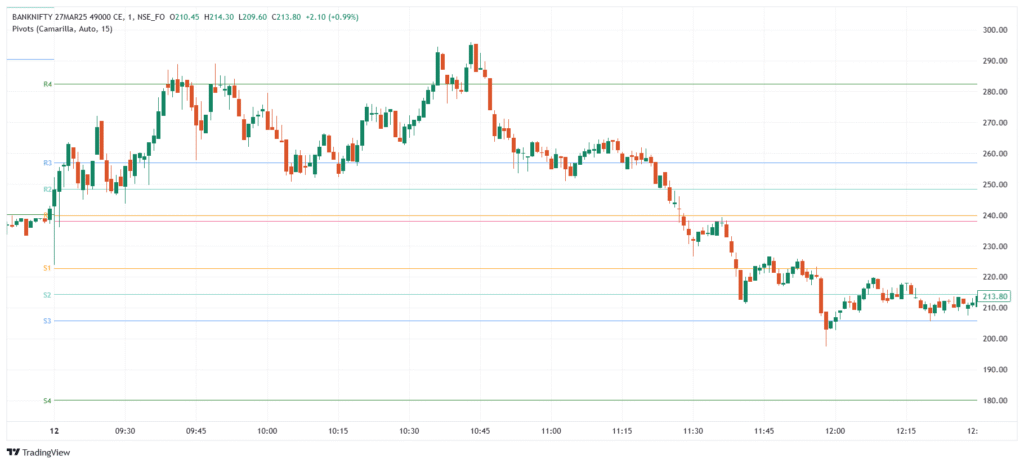
Pivot Points are key price levels used in technical analysis to identify potential support and resistance zones. Calculated from the previous day’s high, low, and close, they help forecast price movement in the current session. The main level is the Pivot Point (P), with additional support (S1, S2…) and resistance (R1, R2…) levels plotted around it. Pivot Points are widely used in intraday and short-term trading to anticipate price reactions, breakouts, and reversals.
💡 Significance
- Help identify support and resistance levels for entries, exits, or stop-losses.
- Provide fixed daily levels, offering consistent structure.
- Useful for quick decision-making in day and swing trading.
- Confirm trend strength when levels are broken or respected.
- Help set price targets and risk management levels.
📊 Indicator Components & Values
- Pivot Point (P) = (High + Low + Close) ÷ 3
- Resistance Levels:
- R1 = (2 × P) − Low
- R2 = P + (High − Low)
- R3 = High + 2 × (P − Low)
- R4 = High + 3 × (P − Low) (used in extreme volatility)
- Support Levels:
- S1 = (2 × P) − High
- S2 = P − (High − Low)
- S3 = Low − 2 × (High − P)
- S4 = Low − 3 × (High − P) (used in extreme drops)
- Price Positioning:
- Above Pivot → Bullish bias
- Below Pivot → Bearish bias
- Fixed Levels: Calculated once daily and remain unchanged during the session.
🧩 Types of Pivot Points
- Central Pivot Range (CPR) – Based on HLC; provides Pivot, TC, BC for trend bias.
- Standard (Classic) – Based on average of High, Low, Close (HLC); most widely used.
- Fibonacci – Uses Fibonacci ratios to calculate support/resistance.
- Woodie’s – Gives more weight to the Close price for pivots.
- Camarilla – Uses a unique constant (1.1–1.5) for tighter intraday S/R.
- Demark – Depends on Open–Close relationship; ideal for breakout signals.
- Floor Pivots – Traditional floor-trader method with midpoint levels.
⚖️ Comparison of Pivot Point Types
| Indicator | Calculation Basis | Key Levels | Best For | Breakout Strategy | Market Suitability |
| Central Pivot Range (CPR) | High, Low, Close (HLC) | Pivot (P), TC, BC | Intraday or Swing Trading | Breakout Above/Below CPR | Trending & Consolidating |
| Classic Pivot Points (PPS) | HLC | P, S1–S3, R1–R3 | Short-term Key Levels | Price Crosses R1/S1 | Support–Resistance Trading |
| Fibonacci Pivot Points | HLC + Fibonacci Ratios | P, S1–S3, R1–R3 (Fib Ratios) | Swing/Position & Intraday Levels | Breakout Beyond Fibonacci S/R | Trend & Range Markets |
| Camarilla Pivot Points | HLC × Constant (1.1–1.5) | P, S1–S4, R1–R4 | Intraday Reversals | Price Rebounds or Breaks S4/R4 | Mean-Reversion & Volatile Markets |
| Woodie’s Pivot Points | HLC (Weighted to Close) | P, S1–S3, R1–R3 | Traders focusing on Closing Strength | Price Crosses Key Levels | Trend-Based Trading |
| Demark Pivot Points | Conditional on Open/Close | Dynamic (varies) | Dynamic Support & Resistance | Depends on Market Conditions | Conditional Trend Analysis |
| Floor Pivot Points | HLC with Open Price | P, S1–S3, R1–R3 (Modified) | Floor Traders & Scalpers | Breakout Above/Below Floor Pivot | Scalping & Day Trading |
Extended Levels: R3, R4 and S3, S4
- Used in high volatility, strong trend, or news-driven sessions.
- Help plan larger targets, wider stop-losses, or early reversal zones.
- Ideal for institutional models, automated systems, or event trading.
- Often act as outer boundaries in extreme price moves.
🎯 Trading Strategy
- Bounce Strategy → Buy near S1/S2, sell near R1/R2 when price respects levels.
- Breakout Strategy → Enter when price breaks through R1 or S1 with strong momentum.
- Pivot Reversal → Watch for reversal signs at pivot levels.
- Combine with Indicators → Use RSI, MACD, or Moving Averages for confirmation.
- Set Stop-loss/Targets → Use S/R levels logically to place risk-managed trades.
- Advanced Planning → Use R3–R4/S3–S4 for extreme moves or longer targets.
