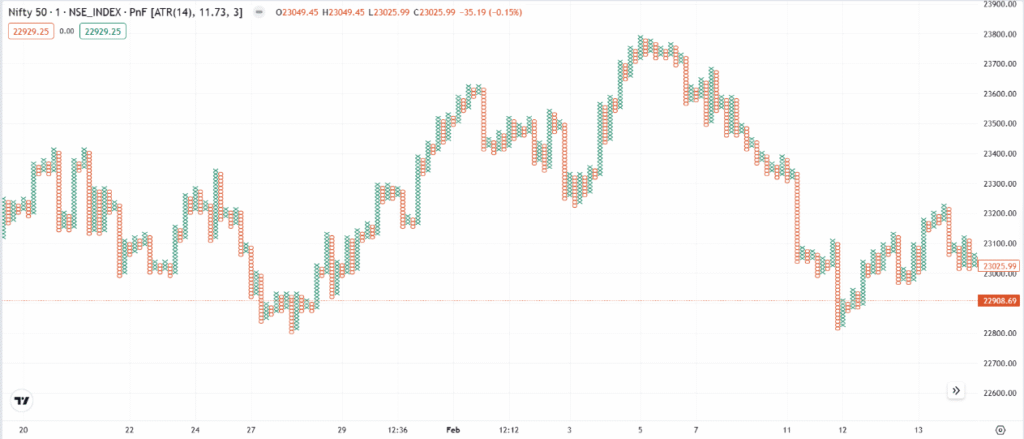
The Point & Figure (P&F) Chart was introduced in the late 19th century and refined by Charles Dow, the founder of Dow Theory. Unlike time-based charts, it focuses only on price movements, using X’s for rising prices and O’s for falling prices. P&F charts help traders filter out market noise and identify breakout levels and trend reversals.
Chart Construction
- Uses X’s to represent rising prices and O’s for falling prices.
- A new column starts when the price reverses by a predefined amount.
- Ignores time and focuses only on price movement.
Importance
- Eliminates market noise by filtering out minor price fluctuations.
- Helps traders identify strong trends and support/resistance levels.
- Useful for breakout and long-term trading strategies.
Limitations
- Not ideal for short-term trading due to the focus on larger price moves.
- Does not display exact price levels at specific times.
Rate this post
