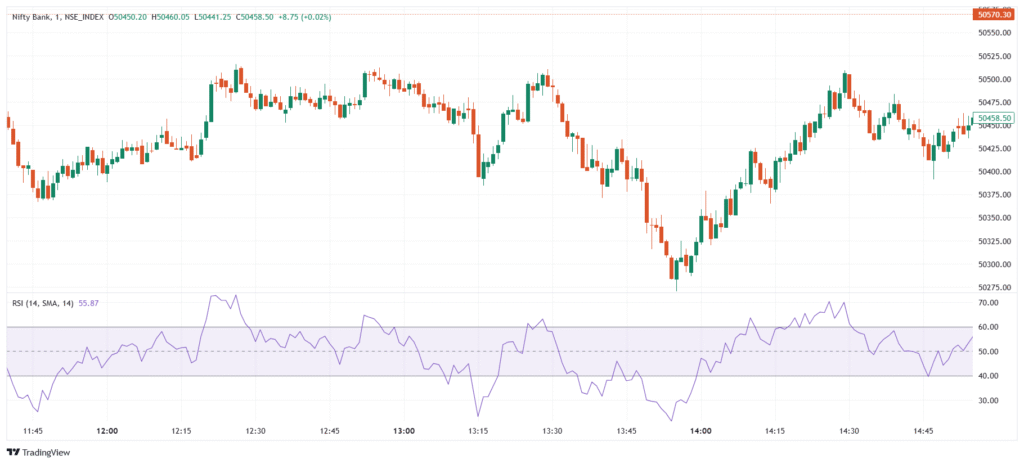
The Relative Strength Index (RSI) is a momentum oscillator developed by J. Welles Wilder Jr. to measure the strength of price movements. It ranges from 0 to 100, with above 70 indicating overbought conditions (potential sell signal) and below 30 indicating oversold conditions (potential buy signal). RSI helps traders identify momentum shifts, trend strength, and potential reversals in various market conditions.
💡 Significance & Purpose
- Identifies overbought and oversold levels for potential reversal points.
- Measures momentum strength to determine if a trend is gaining or losing strength.
- Detects trend reversals when RSI moves from overbought or oversold levels.
- Works in all market conditions, including trending and ranging markets.
- More reliable with other indicators like Moving Averages and MACD for confirmation.
📊 Indicator Components & Values
- RSI Line → A plotted line between 0 and 100, showing momentum strength.
- Period Range → Commonly 14 days, adjusting sensitivity based on timeframe.
- Overbought & Oversold Levels → Above 70 suggests overbought, below 30 suggests oversold.
- Divergence Signals → RSI moving opposite to price can indicate potential reversals.
🎯 Trading Strategy
- Overbought & Oversold Strategy → Buy when RSI < 30, sell when RSI > 70.
- Trend Confirmation → Trade in the trend direction when RSI stays between 40-60.
- RSI + Moving Average → Use a 50-MA or 200-MA to confirm RSI signals with trend direction.
- Divergence Strategy → Buy when price makes a lower low, but RSI makes a higher low (bullish divergence), and sell on the opposite.
- RSI + MACD → Confirm RSI signals with MACD crossovers for stronger trade setups.
