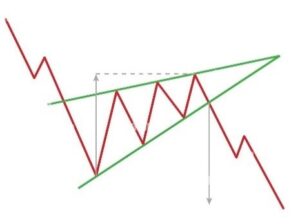
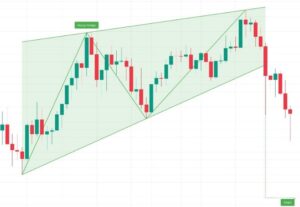
A narrowing upward pattern where price forms higher highs and higher lows, but the range contracts before breaking downward. This pattern signals that buyers are losing momentum, and a breakdown confirms a bearish trend.
💡 Significance
- Suggests that buying pressure is weakening, despite the uptrend.
- Often leads to a sharp price decline once support breaks.
- A breakout to the downside confirms the trend reversal.
✳️ Formation Context
- Forms after a sustained uptrend, where each rally becomes weaker and narrower
- Pattern develops as price compresses upward within converging lines
- Signals loss of control by buyers and potential distribution by smart money
🔷 Characteristics
- Higher highs and higher lows form two converging upward trendlines
- Volume typically declines as the wedge progresses, showing loss of momentum
- Breakdown below lower trendline signals start of bearish move
- May result in false breakouts, so confirmation is essential
🌐 Market Condition
- Works best in uptrending markets where momentum starts weakening
- Suited for indices, large-cap stocks, and commodities nearing exhaustion
🎯 Trading Strategy
- Entry Point: Sell when price breaks below the lower trendline with volume
- Stop-loss: Just above the last swing high within the wedge
- Target Price: Measure the height of the wedge base and subtract from breakdown
Rate this post

