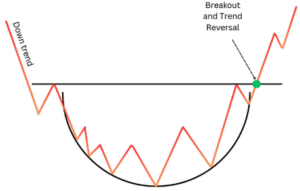
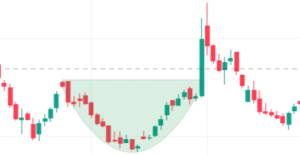
A U-shaped formation that indicates a gradual reversal from a downtrend to an uptrend. The pattern develops over an extended period, showcasing a slow shift in market sentiment from bearish to bullish. A breakout above the resistance level confirms the trend reversal.
✳️ Formation Context
- Forms after a sustained downtrend, as bearish momentum fades and accumulation begins
- Price forms a smooth, curved base showing transition from sellers to buyers
- Typically seen in weekly or daily charts during extended correction phases
🔷 Characteristics
- Price movement forms a broad U-shape, with no sharp lows or highs
- Volume is low during the base and increases as price nears breakout
- Breakout occurs when price crosses above resistance formed at the start of the decline
- Pattern develops slowly, often over weeks or months
🌐 Market Condition
- Best suited for long-term investments in stocks and indices recovering from deep corrections
- Effective in equity and commodity markets showing bottoming behavior
🎯 Trading Strategy
- Entry Point: Buy when price breaks above the resistance level with strong volume
- Stop-loss: Below the midpoint of the base or recent swing low
- Target Price: Measure the depth of the base and project it upward from the breakout

