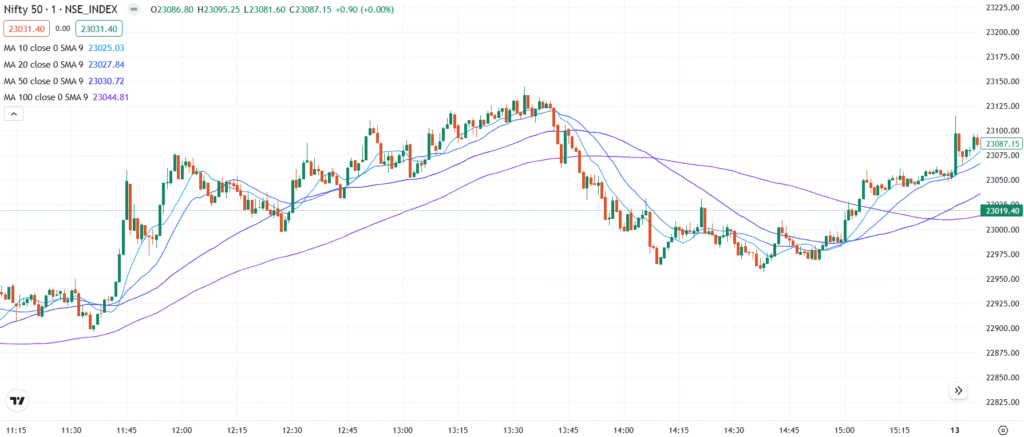
The Simple Moving Average (SMA) is a popular technical indicator that helps traders identify price trends. It calculates the average closing price of a stock or asset over a set number of days, smoothing out short-term price movements to make trends clearer.
💡 Significance
- Identifying trends – Shows if prices are moving up (bullish) or down (bearish).
- Support & resistance levels – Prices often bounce off the SMA.
- Generating trading signals – Helps traders decide when to buy or sell.
- Reducing price noise – Makes price movements easier to understand.
- Works best in trending markets (clear uptrend or downtrend).
- Not effective in sideways markets, as price fluctuates around the SMA.
📊 Indicator Value & Interpretation
- Short-term SMA (10, 20 periods) – Reacts quickly to price changes, used for short-term trading.
- Medium-term SMA (50 periods) – Provides balanced signals, useful for swing traders.
- Long-term SMA (100, 200 periods) – Shows major trends, used by long-term investors.
🎯 Trading Strategy
- Trend Confirmation:
- Price above SMA → Uptrend (bullish) → Buying opportunity.
- Price below SMA → Downtrend (bearish) → Selling opportunity.
- SMA Crossovers for Trading Signals:
- Golden Cross (Buy Signal): Short-term SMA crosses above a long-term SMA → Strong uptrend.
- Death Cross (Sell Signal): Short-term SMA crosses below a long-term SMA → Weakening trend.
- Support & Resistance Levels:
- Uptrend: SMA acts as support → Price may bounce up.
- Downtrend: SMA acts as resistance → Price may drop further.
