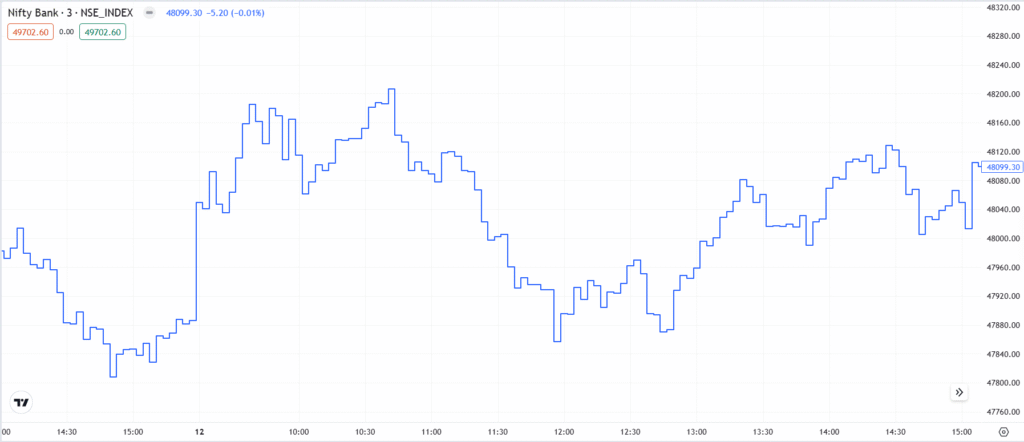
The Stepline Chart is a variation of the Line Chart, introduced in quantitative finance and algorithmic trading in the mid-20th century. Instead of smooth curves, it uses horizontal and vertical steps to display price movements. Stepline charts are ideal for highlighting sudden price jumps and market gaps, making them useful for trend traders.
Chart Construction
- A line chart where price movements appear as steps instead of smooth lines.
- A horizontal segment forms when price remains unchanged.
- A vertical jump occurs when price moves up or down.
Importance
- Highlights sharp price movements more effectively than a standard line chart.
- Useful for analysing stop-and-go price changes, making it beneficial for trend traders.
- Helps in breakout and resistance-level analysis.
Limitations
- Less commonly used by retail traders, so interpretation might not be intuitive.
- Not ideal for markets with gradual price trends, as steps can look artificial.
Rate this post
