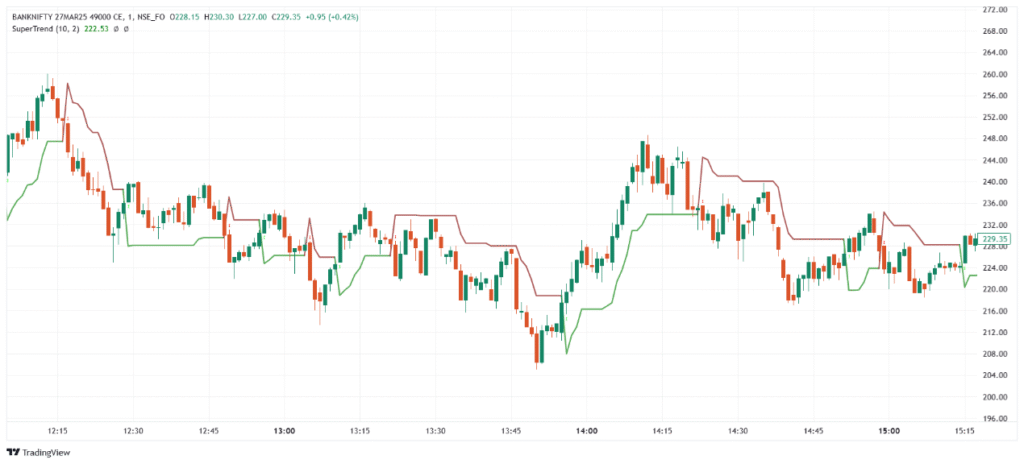
The Supertrend is a trend-following indicator that helps identify the direction of the market and gives clear buy or sell signals. It is plotted as a line above or below the price, changing position when the trend reverses. Supertrend uses the Average True Range (ATR) and a multiplier to determine its position and sensitivity. It works best in trending markets, offering easy visual cues for traders to follow the price direction.
💡 Significance
- Identifies market trend with clear color-coded signals.
- Simplifies trading decisions by showing whether to buy or sell.
- Adapts to volatility using ATR, adjusting to market conditions.
- Provides trailing stop-loss level for trade protection.
- Works well with other indicators like MACD or RSI for confirmation.
📊 Indicator Components & Values
- Supertrend Line → Plotted above or below price based on trend direction.
- ATR (Average True Range) → Measures volatility; affects Supertrend’s distance from price.
- Multiplier → Typically set to 3 or 1.5, adjusts the sensitivity of the indicator.
- Trend Signal →
- Line below price = Uptrend (Buy signal)
- Line above price = Downtrend (Sell signal)
- Color Change → Line shifts color or position when the trend reverses.
🎯 Trading Strategy
- Basic Strategy →
- Buy when Supertrend flips below price and turns green.
- Sell when Supertrend flips above price and turns red.
- Supertrend + Moving Average → Trade only when Supertrend and MA both confirm the same direction.
- Supertrend + RSI → Use RSI to avoid overbought/oversold traps and confirm trend strength.
- Trailing Stop Strategy → Use Supertrend line as a dynamic stop-loss to lock in profits.
- Breakout Confirmation → Enter trades after price breaks a key level and Supertrend aligns with direction.
Rate this post
