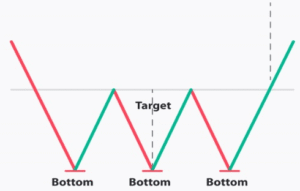
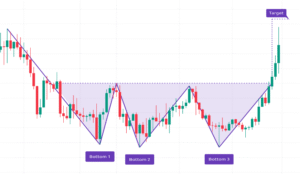
A bullish reversal pattern that forms when the price tests a support level three times but fails to break lower. This pattern signals strong buying pressure and a potential trend reversal from a downtrend to an uptrend. It is considered stronger than the Double Bottom since price has tested the support multiple times, showing that sellers have exhausted their control.
💡 Significance
- Suggests that sellers have tried and failed three times to push the price lower.
- Indicates buyer accumulation, making the support level stronger.
- A breakout above the resistance confirms a trend reversal, signalling a shift to bullish momentum.
✳️ Formation Context
- Appears after a sustained downtrend, with price bouncing off support thrice
- Pattern completes when price breaks above the resistance formed between lows
- Signals the end of accumulation phase and transition to an uptrend
🔷 Characteristics
- Three distinct troughs form around the same support level
- Resistance line connects the highs between the lows
- Breakout above resistance confirms the bullish reversal
- Volume increases at breakout, supporting trend reversal strength
🌐 Market Condition
- Best suited for stock and commodity markets showing recovery signs
- Works well in liquid instruments during bottom formation or oversold zones
🎯 Trading Strategy
- Enter long when price breaks above the resistance with strong volume confirmation.
- Set stop-loss just below the third low to control downside risk.
- Target is derived by adding pattern height to the breakout level.

