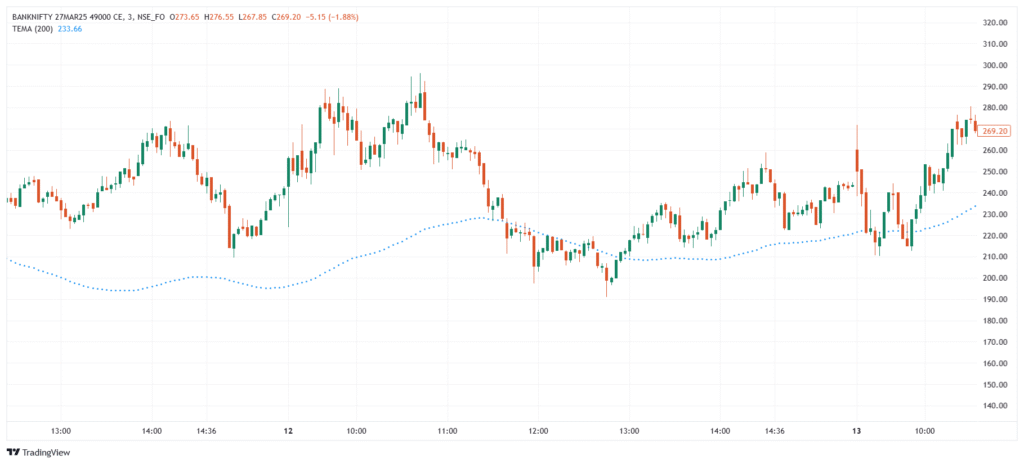
The Triple Exponential Moving Average (TEMA) is a refined trend-following indicator that aims to reduce the lag seen in traditional moving averages. It was developed by Patrick Mulloy and is calculated using a combination of a single, double, and triple EMA. TEMA responds faster to price movements than a simple or exponential moving average, making it useful for short-term trend identification and smoother signals.
💡 Significance
- Reduces lag compared to traditional EMAs.
- Tracks price direction more accurately in trending markets.
- Responds quickly to recent price changes.
- Useful for short-term signals and early entries/exits.
- Works well with other indicators like MACD or RSI for confirmation.
📊 Indicator Components & Values
- TEMA Line → A smoothed line combining EMA, EMA of EMA, and EMA of EMA of EMA.
- Faster than EMA → Offers quicker reactions to price changes.
- Lag reduction → Designed to maintain smoothness while minimizing delay.
- Common period → Typically set to 20 or 30, but adjustable to fit trading style.
- No fixed levels → Interpretation is based on its slope and relation to price.
🎯 Trading Strategy
- Trend Following → Buy when price is above TEMA and the line is rising; sell when below TEMA and the line is falling.
- Crossover Strategy → Use TEMA + SMA or EMA; a TEMA crossover above a slower MA gives a buy signal, and vice versa.
- Pullback Entry → Enter on price dips near TEMA in an uptrend, or rallies near TEMA in a downtrend.
- TEMA + MACD → Combine with MACD to confirm momentum and filter false entries.
- Trailing Stop Strategy → Use TEMA as a dynamic support/resistance to trail stops in trending markets.
