
A Bullish Flag is a short-term continuation pattern that appears after a strong price rally…
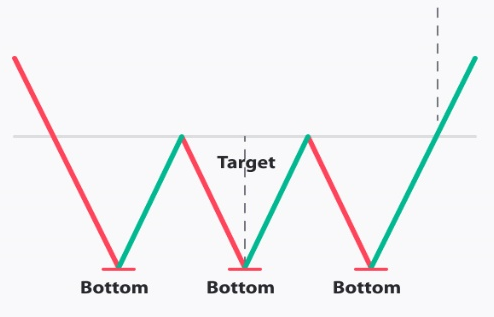
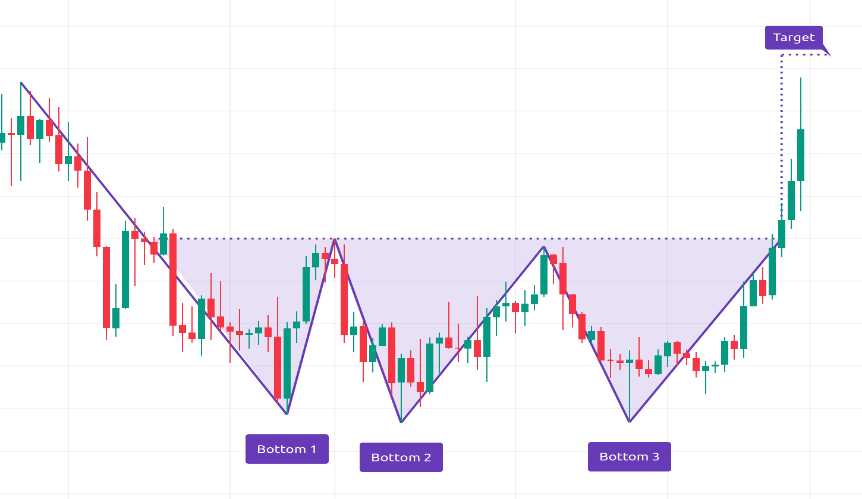
Triple Bottom
A bullish reversal pattern that forms when the price tests a support level three times but fails to break lower. This pattern signals strong buying pressure and a potential trend reversal from a downtrend to an uptrend. It is considered stronger than the Double Bottom since price has tested the support multiple times, showing that sellers have exhausted their control.
Significance
- Suggests that sellers have tried and failed three times to push the price lower.
- Indicates buyer accumulation, making the support level stronger.
- A breakout above the resistance confirms a trend reversal, signalling a shift to bullish momentum.
Characteristics
- Three equal or near-equal lows, touching the same support level.
- The middle peaks between the lows form a resistance level; a breakout confirms the pattern.
- Volume generally decreases during formation and spikes at breakout, confirming strong buyer interest.
Market Condition
- Forms after a prolonged downtrend, indicating that price has reached a strong support zone.
- More reliable when combined with indicators like RSI divergence (showing weakening bearish momentum) or MACD bullish crossover.
Trading Strategy
- Entry point – Buy when price breaks above the resistance level with strong volume.
- Stop-loss – Below the last low of the pattern to manage risk.
- Target price – Measure the pattern height (distance from lows to resistance) and add it to the breakout level.